

GUELPH, Ontario, Nov. 13, 2019 /PVTIME/ — Canadian Solar Inc. (“Canadian Solar” or the “Company”) (NASDAQ: CSIQ), one of the world’s largest solar power companies, today announced financial results for the third quarter ended September 30, 2019.

Third Quarter 2019 Highlights
- Total solar module shipments were 2,387 MW, compared to 2,143 MW in the second quarter of 2019 and third quarter 2019 guidance of 2.2 GW to 2.3 GW.
- Net revenue was $759.9 million, compared to $1.0 billion in the second quarter of 2019 and third quarter 2019 guidance of $780 million to $810 million.
- Gross margin was 26.2%, compared to 17.6% in the second quarter of 2019 and third quarter 2019 guidance of 24% to 26%. Gross margin was 23.0% excluding a $24.3 million countervailing duty (“CVD”) true-up benefit.
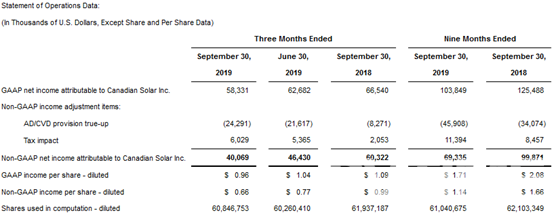
- Net income attributable to Canadian Solar on a GAAP basis was $58.3 million, or $0.96 per diluted share, compared to $62.7 million, or $1.04 per diluted share, in the second quarter of 2019.
- Net income attributable to Canadian Solar on a non-GAAP basis was $40.1 million, or $0.66 per diluted share. This excludes a $24.3 million CVD true-up benefit, net of income tax effect. For a reconciliation of results under generally accepted accounting principles in the United States (“GAAP”) to non-GAAP results, see the accompanying table “About Non-GAAP Financial Measures”.
- Net cash provided by operating activities was approximately $22.4 million, compared to $225.8 million in the second quarter of 2019.
- As of September 30, 2019, the Company’s portfolio of utility-scale solar power plants in operation was 795.8 MWp with an estimated total resale value of approximately $900 million.
Third Quarter 2019 Results
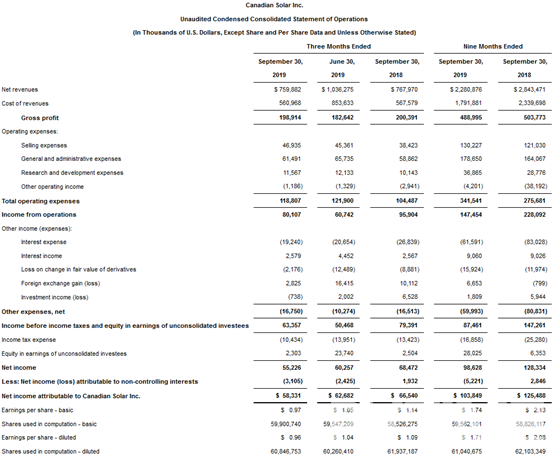
Net revenue in the third quarter of 2019 was $759.9 million, compared to $1.0 billion in the second quarter of 2019, and $768.0 million in the third quarter of 2018. The sequential decline primarily reflects the lower revenue from the sale of solar power plants.
Total solar module shipments in the third quarter of 2019 were 2,387 MW, compared to 2,143 MW in the second quarter of 2019 and third quarter 2019 guidance of 2.2 GW to 2.3 GW. Total solar module shipments in the third quarter of 2019 included 61 MW shipped to the Company’s utility-scale solar power projects. Solar module shipments recognized in revenue in the third quarter of 2019 totaled 2,156 MW, compared to 2,376 MW in the second quarter of 2019 and 1,521 MW in the third quarter of 2018.
Gross profit in the third quarter of 2019 was $198.9 million, compared to $182.6 million in the second quarter of 2019 and $200.4 million in the third quarter of 2018. The benefit for the anti-dumping (“AD”) and CVD true-up was $24.3 million in the third quarter of 2019, $21.6 million in the second quarter of 2019, and $8.3 million, in the third quarter of 2018.Gross margin in the third quarter of 2019 was 26.2%, compared to 17.6% in the second quarter of 2019 and 26.1% in the third quarter of 2018. Non-GAAP gross margin, which excludes the impact of the quarterly AD/CVD true-up, was 23.0% in the third quarter of 2019, compared to 15.5% in the second quarter of 2019 and 25.0% in the third quarter of 2018.
The Company’s Module and System Solutions (“MSS”) business comprises primarily the design, development, manufacture and sale of solar modules, other solar power products and solar system kits. The MSS business also provides engineering, procurement and construction (“EPC”) and operating and maintenance (“O&M”) services. The Company’s Energy business comprises primarily the development and sale of solar projects, operating solar power projects and the sale of electricity. Module sales from the MSS business to the Energy business are on terms and conditions similar to sales to third parties.
The Company develops solar power projects worldwide. Where applicable, the Company may apply for and/or be entitled to receive a feed-in tariff (“FIT”) for its projects. Alternatively, the Company may participate in public or private energy auctions and bidding, which result in long-term power purchase agreements (“PPAs”). The Company may also sell all or a portion of the electricity generated from its solar power projects on the merchant power market. Due to the relatively long lead times (usually two to four years) required to develop solar power projects and bring them to a commercial operation date (“COD”), the actual gross margin of a project may deviate from the expected gross margin. The deviation may be caused by, among other things, changes in political and economic conditions in host countries, project specific conditions, fluctuations in the price of solar modules and other components, changes in the cost of EPC services and the capital return requirements of solar asset buyers. In recent years, the Company has sold some solar power projects before COD. We typically refer to these sales as “notice to proceed” or NTP sales. In NTP sales, the revenue is lower while the gross margin percentage is higher than in COD sales, even if the absolute margin is the same. Results from the Energy business may be lumpy from quarter to quarter, depending on whether projects are sold at NTP or COD, project sale transaction dates and the profit level of each project.
The following tables provide selected financial data for the Company’s MSS and Energy businesses:
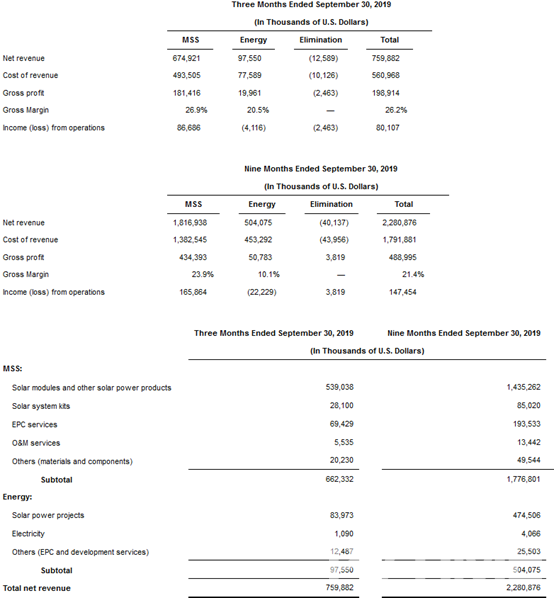
Total operating expenses in the third quarter of 2019 were $118.8 million, compared to $121.9 million in the second quarter of 2019 and $104.5 million in the third quarter of 2018.
Selling expenses in the third quarter of 2019 were $46.9 million, compared to $45.4 million in the second quarter of 2019 and $38.4 million in the third quarter of 2018. The sequential increase was primarily due to an increase in shipping and handling costs, partially offset by lower project transaction fees.
General and administrative expenses in the third quarter of 2019 were $61.5 million, compared to $65.7 million in the second quarter of 2019 and $58.9 million in the third quarter of 2018. The sequential decrease was mainly due to a $7.3 million decrease in impairment in the third quarter of 2019, compared to the second quarter of 2019 and $1.6 million decrease in labor cost, partially offset by a $6.0 million customer settlement.
Research and development expenses in the third quarter of 2019 were $11.6 million, compared to $12.1 million in the second quarter of 2019 and $10.1 million in the third quarter of 2018.
Other operating income in the third quarter of 2019 was $1.2 million, compared to $1.3 million in the second quarter of 2019 and $2.9 million in the third quarter of 2018.
Income from operations in the third quarter of 2019 was $80.1 million, compared to $60.7 million in the second quarter of 2019, and $95.9 million in the third quarter of 2018. Operating margin was 10.5% in the third quarter of 2019, compared to 5.9% in the second quarter of 2019 and 12.5% in the third quarter of 2018.
Non-cash depreciation and amortization charges in the third quarter of 2019 were $37.0 million, compared to $39.7 million in the second quarter of 2019 and $32.5 million in the third quarter of 2018. Non-cash equity compensation expense in the third quarter of 2019 was $2.8 million, compared to $3.5 million in the second quarter of 2019 and $2.5 million in the third quarter of 2018.
Interest expense in the third quarter of 2019 was $19.2 million, compared to $20.7 million in the second quarter of 2019 and $26.8 million in the third quarter of 2018.
Interest income in the third quarter of 2019 was $2.6 million, compared to $4.5 million in the second quarter of 2019 and $2.6 million in the third quarter of 2018.
The Company recorded a loss on the change in fair value of derivatives in the third quarter of 2019 of $2.2 million, compared to $12.5 million in the second quarter of 2019 and $8.9 million in the third quarter of 2018. Foreign exchange gain in the third quarter of 2019 was $2.8 million, compared to $16.4 million in the second quarter of 2019, and $10.1 million in the third quarter of 2018.
Income tax expense in the third quarter of 2019 was $10.4 million, compared to $14.0 million in the second quarter of 2019 and $13.4 million in the third quarter of 2018.
Net income attributable to Canadian Solar in the third quarter of 2019 was $58.3 million or $0.96 per diluted share, compared to net income of $62.7 million or $1.04 per diluted share in the second quarter of 2019 and net income of $66.5 million or $1.09 per diluted share in the third quarter of 2018.
Financial Condition
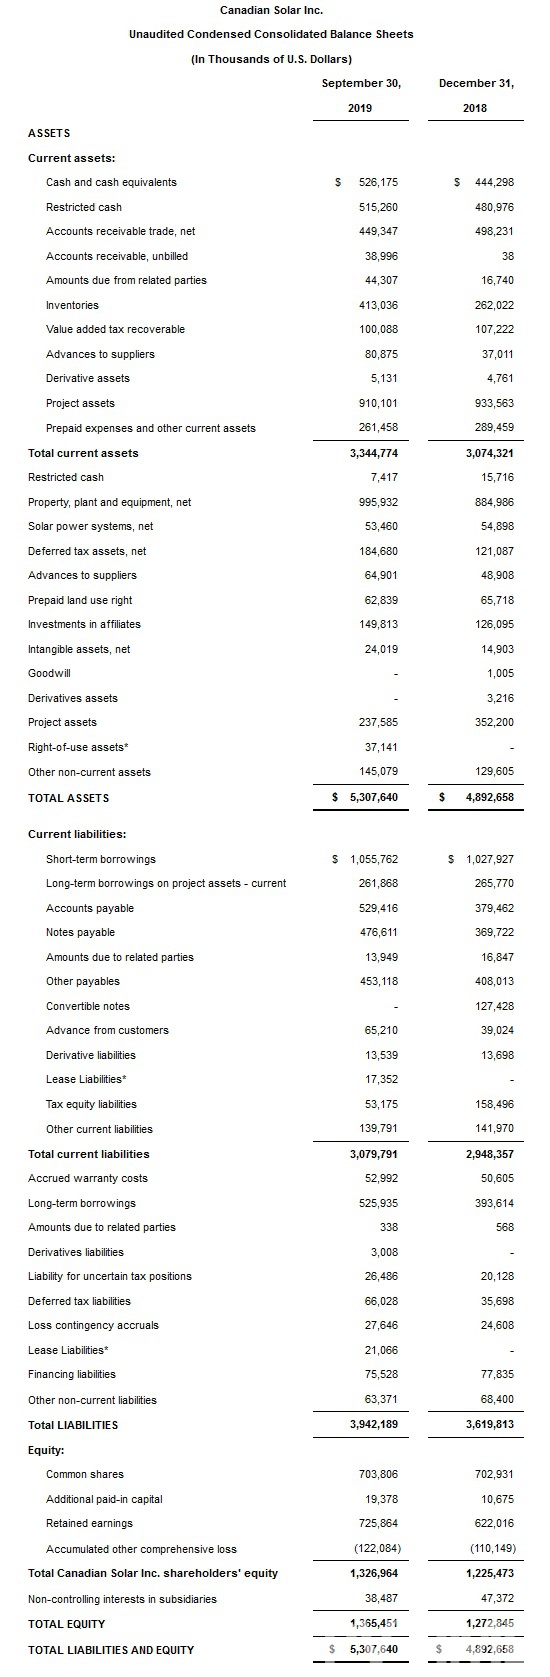
The Company had $1,048.9 million of cash, cash equivalents and restricted cash as of September 30, 2019, compared to $981.0 million as of June 30, 2019.
Accounts receivable, net of allowance for doubtful accounts, at the end of the third quarter of 2019 were $449.3 million, compared to $454.6 million at the end of the second quarter of 2019. Accounts receivable turnover in the third quarter of 2019 was 64 days, compared to 41 days in the second quarter of 2019.
Inventories at the end of the third quarter of 2019 were $413.0 million, compared to $337.8 million at the end of the second quarter of 2019. Inventory turnover in the third quarter of 2019 was 63 days, compared to 40 days in the second quarter of 2019.
Accounts and notes payable at the end of the third quarter of 2019 were $1,006.0 million, compared to $926.2 million at the end of the second quarter of 2019.
Short-term borrowings and the current portion of long-term borrowings on project assets at the end of the third quarter of 2019 were $1.3 billion, compared to $1.3 billion at the end of the second quarter of 2019. Long-term borrowings at the end of the third quarter of 2019 were $525.9 million, compared to $462.9 million at the end of the second quarter of 2019.
Total borrowings directly related to the Company’s utility-scale solar power projects were $670.8 million at the end of the third quarter of 2019, compared to $640.5 million at the end of the second quarter of 2019. Total debt at the end of the third quarter of 2019 was $1.97 billion, compared to $1.86 billion at the end of the second quarter of 2019.
Dr. Shawn Qu, Chairman and Chief Executive Officer, commented: “Q3 was another strong, highly profitable quarter for Canadian Solar. Our results reflect robust global demand for our solar power products, the benefit of stable pricing trends and continued execution by our team. Strategic decisions we made in R&D and manufacturing efforts have positioned Canadian Solar at the forefront of solar cell and module manufacturing technology. For example, we recently set another world record of 22.8% conversion efficiency for P-type large area multi-crystalline silicon solar cells. We remain committed to developing and commercializing the solar technologies and system innovations that drive efficiency levels higher and total cost of ownership lower. This approach brings additional value to our customers and helps ensure the Company’s long-term success. We have significant room for growth ahead of us and remain positive in our outlook given further improvements in our backlog and visibility.”
Yan Zhuang, Acting Chief Executive Officer, commented: “Our solar module shipments and gross margin expansion underscore the solid execution of our strategies in both our MSS and Energy businesses. Higher module shipments were led by the success of Canadian Solar’s premium brand and the strength of the global sales channels we have built over many years. Our solid track record has also allowed us to grow our presence across the solar supply chain. During the third quarter, we signed an O&M agreement for third party projects totaling 300 MWp; and completed the sale of the 266 MWp Rambler project in the U.S. and the sale of an 80% interest in the 171.5 MWp Lavras project in Brazil. In addition, we won a total of 424 MWp of projects with attractive PPAs, energized a 100 MWp project in Argentina and secured additional project development financing at favorable rates. Globally, as of September 30, 2019, we had a 3.4 GWp pipeline of late-stage, utility-scale solar power projects. In addition, our 796 MWp portfolio of solar power plants under operation has an estimated resale value of approximately $900 million.”
Dr. Huifeng Chang, Senior Vice President and Chief Financial Officer, added: “We achieved GAAP net income of $58 million, or $0.96 per diluted share, for the third quarter even with lower than expected revenue which was primarily due to the delayed closing of solar power plant sales in Japan. This reflects an underlying improvement in our operating and financial performance as well as benefit from the CVD true-up adjustment of $24 million. Our focus on operating efficiency improvements helped us further reduce our blended module manufacturing costs. In October, we completed the sale of an 80% interest in 353 MWp of projects in Brazil, in addition to the 80% interest in the 171.5 MWp Lavras project which we sold in August. We will continue to monetize the remainder of our 3.4 GWp late-stage utility-scale solar project pipeline through 2020 and to maintain a balance between driving profitable growth and strengthening the Company’s balance sheet.”
Utility-Scale Solar Project Pipeline
The Company divides its utility-scale solar project pipeline into two categories: an early-to-mid-stage pipeline and a late-stage pipeline. The late-stage pipeline includes primarily those projects that have FITs or PPAs and are expected to be built within the next four years. The Company cautions that some late-stage projects may not reach completion due to such factors as failure to secure permits and grid connection, and changes of political and economic conditions in host countries, among others.
Late-Stage Utility-Scale Solar Project Pipeline
As of September 30, 2019, the Company’s late-stage, utility-scale solar project pipeline, including those in construction, totaled approximately 3.4 GWp, with 1,285 MWp in the U.S., 832 MWp in Brazil, 370 MWp in Mexico, 343.5 MWp in Japan, 145 MWp in China and an additional 422.1 MWp in Australia, Canada, Israel, Taiwan, the Philippines, Malaysia, Italy and South Korea.
In the United States, as of September 30, 2019, the Company’s late-stage, utility-scale solar project pipeline totaled 1,285 MWp* as detailed in the table below.
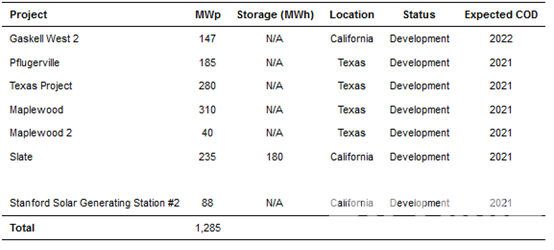
*This table does not include the 100 MWac Sunflower project located in Mississippi. In November 2018, the Company entered into a build-to-transfer agreement with Entergy Mississippi for the Sunflower project. As part of the agreement, Entergy Mississippi will serve as both project owner and electricity off-taker once the project is constructed and transferred to them. This build-to-transfer agreement is pending approval by the Mississippi Public Service Commission.
In Japan, as of September 30, 2019, the Company’s late-stage, utility-scale solar project pipeline for which interconnection agreements and FITs have been secured totaled approximately 343.5 MWp, including 104.3 MWp under construction and 239.2 MWp under development.
The table below sets forth the expected COD schedule of the Company’s late-stage utility-scale solar power projects in Japan, as of September 30, 2019:
Expected COD Schedule (MWp)

In Brazil, as of September 30, 2019, the Company had an 832 MWp late-stage, utility-scale solar project pipeline as detailed in the table below.
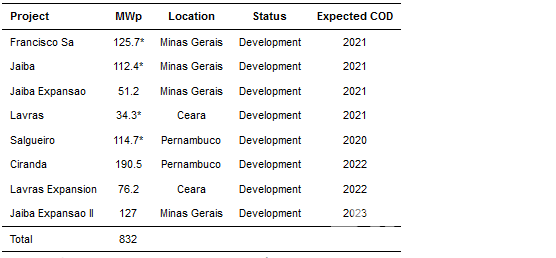
*In April 2019, the Company signed an agreement to sell its 80% interest in the 482.6 MWp (has now expanded to 524.3 MWp) of solar power projects to Nebras Power Investment Management B.V., a Dutch affiliate of Nebras Q.P.S.C. Canadian Solar completed the sale of the 80% interest in the 171.5 MWp Lavras project in August 2019 and the sale of the 80% interest in the Francisco Sa, Jaiba and Salgueiro projects in October 2019.
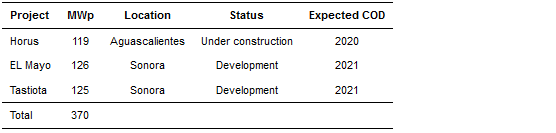
In Mexico, as of September 30, 2019, the Company had a 370 MWp late-stage, utility-scale solar project pipeline as detailed in the table below.
In China, as of September 30, 2019, the Company’s late-stage, utility-scale solar project pipeline was 145 MWp.
Solar Power Plants in Operation
In addition to its late-stage, utility-scale solar project pipeline, as of September 30, 2019, the Company had a portfolio of utility-scale, solar power plants in operation totaling 795.8 MWp. The Company records these power plants on the balance sheet as “project assets (build to sell)”, “assets held-for-sale” and “solar power systems, net (build to own)”. The proceeds of project sales recorded as “project assets (build to sell)” on the balance sheet will be recorded as revenue in the income statement once revenue recognition criteria are met. The gain or loss from the sale of projects recorded as “assets held-for-sale” and “solar power systems, net (build to own)” on the balance sheet will be recorded within “other operating income (expenses)” in the income statement.
The table below sets forth the Company’s total portfolio of utility-scale, solar power plants in operation, as of September 30, 2019 (MWp):

Manufacturing Capacity
The table below sets forth the Company’s manufacturing capacity expansion plan from December 31, 2019 to December 31, 2020.
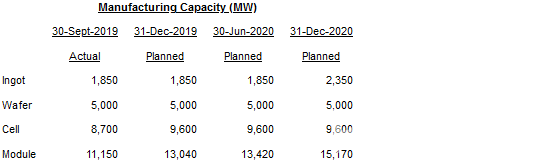
The Company’s manufacturing capacity expansion plan is subject to change based on market conditions.
Business Outlook
The Company’s business outlook is based on management’s current views and estimates given existing market conditions, the Company’s order book and production capacity, the timing of project sales, and the global economic environment. This outlook is subject to uncertainty with respect to, among other things, final customer demand and solar project construction and sale schedules. Management’s views and estimates are subject to change without notice.
For the fourth quarter of 2019, the Company expects total solar module shipments to be in the range of 2.3 GW to 2.4 GW, including approximately 190 MW of shipments to the Company’s utility-scale solar power projects that may not be recognized as revenue in the fourth quarter of 2019. Total revenue for the fourth quarter is expected to be in the range of $850 million to $880 million. Gross margin for the fourth quarter is expected to be between 19% and 21%.
For the full year 2019, the Company now expects total module shipments to the range of approximately 8.4 GW to 8.5 GW. Total revenue for the year is expected to be in the range of $3.13 billion to $3.16 billion.
Yan Zhuang, Acting Chief Executive Officer of Canadian Solar, commented: “While our near-term revenue is expected to be impacted by the potential shift of certain project sales into 1Q 2020 from 4Q 2019 due to revised sales schedules, we expect sequential growth in solar module shipments based on our backlog and demand forecasts. The broader global market remains healthy as we benefit from robust demand in traditional geographies and the development of new markets where our brand, track record and local presence give us a distinct competitive advantage. We expect to gain additional momentum in 2020 as we monetize our late-stage, utility-scale solar project pipeline as well as solar power plants in operation. We also continue to explore opportunities to create additional synergies across the upstream and downstream businesses by leveraging our global purchasing power and providing total solutions to our customers, thereby building value for our Company’s shareholders.”
Recent Developments
On November 11, 2019, Canadian Solar announced that it had been awarded two solar PV projects totaling 190.5 MWp in the 7th Brazilian Federal Auction held in October 2019.
On October 22, 2019, Canadian Solar announced that it had been awarded a 30 MWp project in Japan’s 4th solar energy auction. Once constructed, the project will enter into a 20-year power purchase agreement with Chugoku Power Electric Company at a rate of ¥13.47 ($0.12) per kWh.
On October 10, 2019, Canadian Solar announced that it had been awarded three solar PV projects totaling 393.7 MWp in two recent Private Corporate Auctions held in Brazil during the third quarter of 2019.
On September 17, 2019, Canadian Solar announced that its technology team set a world record of 22.80% conversion efficiency for P-type large area multi-crystalline silicon solar cells.
On September 12, 2019, Canadian Solar announced that its wholly-owned subsidiary, Recurrent Energy, LLC, sold the 200 MWac/266 MWp Rambler solar project to Duke Energy Renewables, a subsidiary of Duke Energy.
On August 28, 2019, Canadian Solar announced that it secured 487.0 million Brazilian reals (US$120 million) in non-recourse project financing from Banco do Nordeste do Brasil S.A. (BNB) for its Francisco Sa and Jaiba solar power projects.
On August 21, 2019, Canadian Solar announced that it signed O&M agreements with Gannawarra Solar Farm Pty Ltd, Hayman Solar Farm Pty Ltd and Daydream Solar Farm Pty Ltd for three solar PV plants totaling 300 MWp in Australia.
On August 5, 2019, Canadian Solar announced that it energized its 100.1 MWp Cafayate solar power project in Argentina on July 19, 2019, the largest operational solar power plant in the country.
Conference Call Information
The Company will hold a conference call at 5:00 p.m. U.S. Eastern Standard Time on November 12, 2019 (6:00 a.m., November 13, 2019 in Hong Kong) to discuss the Company’s third quarter 2019 results and business outlook. The dial-in phone number for the live audio call is +1 866-519-4004 (toll-free from the U.S.), +852-3018-6771 (local dial-in from HK) or +1 845-675-0437 (from international locations). The passcode for the call is 3366785. A live webcast of the conference call will also be available on the Investor Relations section of Canadian Solar’s website at www.canadiansolar.com.
A replay of the call will be available two hours after the conclusion of the call until 8:00 a.m. U.S. Eastern Standard Time on Wednesday, November 20, 2019 (9:00 p.m., November 20, 2019 in Hong Kong) and can be accessed by dialing +1-855-452-5696 (toll-free from the U.S.), +852-3051-2780 (local dial-in from HK) or +1-646-254-3697 (from international locations), with passcode 3366785. A webcast replay will also be available on the investor relations section of Canadian Solar’s at www.canadiansolar.com.
FINANCIAL TABLES FOLLOW
Note: * The Company adopted ASU 2016-02 – Leases (Topic ASC842) in the first quarter of 2019 using the optional transition method and elected certain practical expedients, which were permitted under the guidance ASU 2018-11, Leases (Topic 842) – Targeted Improvements. The transition guidance allowed the Company not to reassess prior conclusions related to contracts containing leases or lease classification. The adoption primarily affected the condensed consolidated balance sheet through the recognition of right-of-use assets and lease liabilities as of January 1, 2019. The adoption did not have a significant impact on the results of operations or cash flows.
About Non-GAAP Financial Measures
To supplement its financial disclosures presented in accordance with GAAP, the Company uses non-GAAP measures which are adjusted from the most comparable GAAP measures for certain items as described below. The Company presents non-GAAP net income and diluted earnings per share so that readers can better understand the underlying operating performance of the business before the impact of AD/CVD true-up provisions. The non-GAAP numbers are not measures of financial performance under U.S. GAAP, and should not be considered in isolation or as an alternative to other measures determined in accordance with GAAP. These non-GAAP measures may differ from non-GAAP measures used by other companies, and therefore their comparability may be limited.
SOURCE: Canadian Solar Inc


 (NASDAQ: CSIQ), one of the world’s largest solar power companies, today announced financial results for…)