

Daqo New Energy Corp. (NYSE: DQor “we”) today announced its unaudited financial results for the fourth quarter and fiscal year of 2018.
Fourth Quarter 2018 Financial and Operating Highlights
- Polysilicon production volume of 7,301 MT in Q4 2018, compared to 4,734 MT in Q3 2018
- Polysilicon external sales volume(1) of 7,030 MT in Q4 2018, compared to 6,199 MT in Q3 2018
- Polysilicon average total production cost(2) of $7.94/kg in Q4 2018, compared to $8.94/kg in Q3 2018
- Polysilicon average cash cost(2) of $6.64/kg in Q4 2018, compared to $7.12/kg in Q3 2018
- Polysilicon average selling price (ASP) was $9.69/kg in Q4 2018, compared to $10.79/kg in Q3 2018
- Revenue from continuing operations was $75.6 million in Q4 2018, compared to $67.4 million in Q3 2018
- Gross profit from continuing operations was $16.9 million in Q4 2018, compared to $12.8 million in Q3 2018. Gross margin from continuing operations was 22.4% in Q4 2018, compared to 19.1% in Q3 2018
- EBITDA (non-GAAP)(3) from continuing operations was $29.5 million in Q4 2018, compared to $14.8 million in Q3 2018
- EBITDA margin (non-GAAP)(3) from continuing operations was 39.1% in Q4 2018, compared to 22.0% in Q3 2018
- Net income from continuing operations was $17.1 million in Q4 2018, compared to $4.2 million in Q3 2018 and $57.7 million in Q4 2017
- Net loss from discontinued operations was $5.7 million in Q4 2018, compared to $22.4 million in Q3 2018 and net loss from discontinued operations of $23.6 million in Q4 2017
- Net income attributable to Daqo New Energy shareholders was $11.4 million in Q4 2018, compared to net loss attributable to Daqo New Energy shareholders of $18.3 million in Q3 2018 and net income attributable to Daqo New Energy shareholders of $33.7 million in Q4 2017.
- Earnings per basic American Depository Share (ADS) was $0.86 in Q4 2018, compared to loss per basic ADS of $1.39 in Q3 2018, and earnings per basic ADS of $3.16 in Q4 2017
- Adjusted net income (non-GAAP)(3) attributable to Daqo New Energy shareholders was $15.7 million in Q4 2018, compared to $4.3 million in Q3 2018 and $35.3 million in Q4 2017
- Adjusted earnings per basic ADS (non-GAAP)(3) of $1.18 in Q4 2018, compared to $0.33 in Q3 2018, and $3.31 in Q4 2017
| Three months ended | |||
| US$ millions except as indicated otherwise | Dec 31, 2018 | Sept 30, 2018 | Dec 31, 2017 |
| Revenues | 75.6 | 67.4 | 118.9 |
| Gross profit | 16.9 | 12.8 | 68.1 |
| Gross margin | 22.4% | 19.1% | 57.3% |
| Operating income | 20.3 | 4.0 | 66.9 |
| Net income from continuing operations | 17.1 | 4.2 | 57.7 |
| Loss from discontinued operations, net of tax | (5.7) | (22.4) | (23.6) |
| Net income/(loss) attributable to Daqo New Energy Corp. shareholders | 11.4 | (18.3) | 33.7 |
| Earnings/(loss) per basic ADS ($ per ADS) | 0.86 | (1.39) | 3.16 |
| Adjusted net income (non-GAAP)(3) attributable to Daqo New Energy Corp. shareholders | 15.7 | 4.3 | 35.3 |
| Adjusted earnings per basic ADS (non-GAAP)(3) ($ per ADS) | 1.18 | 0.33 | 3.31 |
| EBITDA from continuing operations (non- GAAP)(3) | 29.5 | 14.8 | 76.3 |
| EBITDA margin(3) from continuing operations (non-GAAP) | 39.1% | 22.0% | 64.2% |
| Polysilicon sales volume (MT) (1) | 7,030 | 6,199 | 4,730 |
| Polysilicon production cost ($/kg)(2) | 7.94 | 8.94 | 9.40 |
| Polysilicon cash cost (excl. dep’n) ($/kg)(2) | 6.64 | 7.12 | 7.64 |
Full Year 2018 Financial and Operating Highlights

- Polysilicon production volume of 23,351 MT in 2018, compared to 20,200 MT in 2017
- Polysilicon external sales volume(1) of 22,521 MT in 2018, compared to 17,950 MT in 2017
- Revenue from continuing operations of $301.6 million in 2018, compared to $323.2 million in 2017
- Gross profit from continuing operations was $98.1 million in 2018, compared to $144.0 million in 2017. Gross margin of 32.5% in 2018, compared to 44.6% in 2017
- EBITDA (non-GAAP)(3) from continuing operation was $120.4 million in 2018, compared to $158.5 million in 2017
- EBITDA margin (non-GAAP)(3) from continuing operations was 39.9% in 2018, compared to 49.0% in 2017
- Net income attributable to Daqo New Energy Corp. shareholders was $38.1 million in 2018, compared to $92.8 million in 2017
- Earnings per basic ADS was $3.06 in 2018, compared to $8.76 in 2017
- Adjusted net income (non-GAAP)(3) attributable to Daqo New Energy Corp. shareholders was $71.6 million in 2018, compared to $99.5 million in 2017
- Adjusted earnings per basic ADS (non-GAAP)(3) was $5.74 in 2018, compared to $9.38 in 2017
Notes:
(1) The Company’s polysilicon external sales volume excludes internal sales to Daqo New Energy’s Chongqing wafer manufacturing subsidiary, which utilizes polysilicon as raw material for the production of solar wafers and which the Company discontinued in September 2018. There are no internal sales in Q4 2018. The sales volume is the quantity of goods that have been received by customers, and thus the corresponding revenue has been recognized during the period indicated.
(2) Production cost and cash cost only refer to production in our Xinjiang polysilicon facilities. Production cost is calculated by the inventoriable costs relating to production of polysilicon in Xinjiang divided by the production volume in the period indicted. Cash cost is calculated by the inventoriable costs relating to production of polysilicon excluding depreciation expense in Xinjiang, divided by the production volume in the period indicated.
(3) Daqo New Energy provides EBITDA from continuing operations, EBITDA margin from continuing operations adjusted net income attributable to Daqo New Energy Corp. shareholders and adjusted earnings per ADS on a non-GAAP basis to provide supplemental information regarding its financial performance. For more information on these non-GAAP financial measures, please see the section captioned “Use of Non-GAAP Financial Measures” and the tables captioned “Reconciliation of non-GAAP financial measures to comparable US GAAP measures” set forth at the end of this press release.
Management Remarks
“I would like to thank our entire team for their hard work and dedication for delivering another outstanding quarter in which we successfully completed the Phase 3B project and ramped production up to full capacity by the end of November 2018, three months ahead of schedule,” commented Mr. Longgen Zhang, CEO of Daqo New Energy.
“During the quarter, we achieved new record both in production volume and sales volume which were 7,301 MT and 7,030 MT, respectively. With the successful ramp up of our new phase 3B facility and efforts of our operating team, both production volume and cost reduction targets were achieved with excellent results. During the fourth quarter of 2018, we successfully reduced our total production cost to $7.94/kg and our cash cost was lowered to $6.64/kg, representing our lowest cost structure in history. With our Xinjiang production facilities now running at full capacity, we expect to produce approximately 8,500 to 8,700 MT of polysilicon during the first quarter of 2019. Furthermore, with reduction in unit utility usage, operating leverage and other cost savings, we expect to further reduce our total production cost to approximately $7.50/kg. In addition, we plan to conduct a capacity debottlenecking project to gradually upgrade several older CVD furnaces with improved technology, allowing us to increase production capacity by additional 5,000 MT. We plan to start this project in mid-March and complete it by the end of June. The debottlenecking project will have limited impact on production volume, therefore we expect to produce 7,600 to 7,800 MT of polysilicon during the second quarter of 2019. Subsequent to the completion of the debottlenecking project, we anticipate the Company will reach total annual production capacity of 35,000 MT.
“The Phase 4A capacity expansion project is progressing smoothly and will increase our production capacity to 70,000 MT by the end of the first quarter of 2020 with an even lower cost structure once fully ramped up. In February 2019, we received approval from Bank of China for a RMB400 million 5-year fixed-asset capital project loan and a RMB50 million working capital loan. The Company has obtained a total of RMB830 million of additional bank loans, including the loans from Bank of China and credit facilities from other domestic Chinese banks, to support our capacity expansion and working capital needs. These loans will support capital expenditure for our Phase 4A project and enable us to complete it on schedule.”
“2018 was a challenging but also promising year for solar PV industry. The policies issued by the Chinese government on May 31, 2018 immediately impacted the market and resulted in a significant price decline across the entire value chain. However, this fall in price significantly stimulated demands from markets outside of China, especially where grid-parity has already been reached. The global solar PV market recovered rapidly in the following months and has since achieved equilibrium again, even with very limited contribution from China, the world’s largest individual solar PV market.”
“A draft of China’s solar policy for 2019 has already been released with the final version yet to be confirmed. The draft indicates a new incentive program based on a fixed subsidy amount rather that a fixed quota system as was previously done. The fixed subsidy amount is expected to be in the range of approximately RMB 3 billion and could cover approximately 30-35GW of installations. Poverty alleviation projects will be subsidized and funded separately. In addition, the market anticipates some grid-parity projects which will not require central government subsidies. Based on industry research, China’s installation target for 2019 is anticipated to be approximately 40-45 GW but there could be some variations in the final version of China’s policy in 2019. Grid-parity and cost reduction will continue to play a key role in driving global demand from developed markets such as Europe and the US to developing markets like India, South Asia, Africa and South America. We expect global solar installations in 2019 to be approximately 120 to 140 GW.”
“We believe demand for polysilicon, which is the key ultra-pure raw material for crystalline-silicon solar PV module, will keep growing as solar PV becomes more and more competitive compared to other energy sources. We believe the current market challenges are temporary and should be resolved during the second half of 2019, especially when demand and installation from China recovers. Looking forward, we believe the solar PV industry has become much stronger and increasingly independent of policies and is expected to grow sustainably over the long-term with better stability. The pace of new capacity expansion within the polysilicon industry will smooth out going forward. As a leading polysilicon manufacturer, we believe Daqo New Energy is ideally positioned to benefit from this fast growing market and will continue to outperform its peers with lower cost and better quality.”
Outlook and guidance
The Company expects to produce approximately 8,500MT to 8,700MT of polysilicon and sell approximately 8,400MT to 8,600MT of polysilicon to external customers during the first quarter of 2019. The Company will conduct a debottlenecking project by gradually upgrading several older CVD furnaces beginning in mid-March through the end of June in 2019. The debottlenecking project is expected to have a limited impact on production volume. As such, the Company expects to produce 7,600 to 7,800 MT in the second quarter of 2019. For the full year of 2019, the Company expects to produce approximately 37,000 to 40,000 MT of polysilicon, inclusive of the impact of the Company’s annual facility maintenance.
This outlook reflects Daqo New Energy’s current and preliminary view as of the date of this press release and may be subject to change. The Company’s ability to achieve these projections is subject to risks and uncertainties. See “Safe Harbor Statement” at the end of this press release.
Fourth Quarter 2018 Results
Revenues
Revenues were $75.6 million, compared to $67.4 million in the third quarter of 2018 and $118.9 million in the fourth quarter of 2017. The sequential increase in revenues was primarily due to higher polysilicon sales volumes partially offset by lower ASPs.
Gross profit and margin
Gross profit was $16.9million, compared to $12.8 million in the third quarter of 2018 and $68.1 million in the fourth quarter of 2017. Gross margin was 22.4%, compared to 19.1% in the third quarter of 2018 and 57.3% in the fourth quarter of 2017. The sequential increase was primarily due to lower average polysilicon production cost,partially offset by lower ASPs.
Selling, general and administrative expenses
Selling, general and administrative expenses were $8.2 million, compared to $7.6 million in the third quarter of 2018 and $4.5 million in the fourth quarter of 2017. The year-over-year increase in SG&A was primarily due to an increase of non-cash share-based compensation costs related to the Company’s 2018 share incentive plan.
Research and development expenses
Research and development (R&D) expenses were approximately $1.0 million, compared to $1.4 million in the third quarter of 2018 and $0.05 million in the fourth quarter of 2017. Research and development expenses could vary from period to period and reflected R&D activities that took place during the quarter.
Other operating income
Other operating income was $12.5 million, compared to $0.1 million in the third quarter of 2018 and $3.3 million in the fourth quarter of 2017. Other operating income was mainly composed of unrestricted cash incentives that the Company received from local government authorities, the amount of which varies from period to period.
Income from operations and operating margin
As a result of the foregoing, income from operations was $20.3 million, compared to $4.0 million in the third quarter of 2018 and $66.9 million in the fourth quarter of 2017.
Operating margin was 26.8%, compared to 5.9% in the third quarter of 2018 and 56.2% in the fourth quarter of 2017.
Interest expense
Interest expense was $1.9 million, compared to $2.1 million in the third quarter of 2018 and $3.7 million in the fourth quarter of 2017.
EBITDA
EBITDA from continuing operations was $29.5 million, compared to $14.8 million in the third quarter of 2018 and $76.3 million in the fourth quarter of 2017. EBITDA margin was 39.1%, compared to 22.0% in the third quarter of 2018 and 64.2% in the fourth quarter of 2017.
Loss from discontinued operations, net of tax
During the third quarter of 2018, the Company decided to discontinue its solar wafer manufacturing operations. Results of the discontinued operations of the previous quarter and comparative quarter were represented accordingly. Loss on discontinued operations was $5.7 million in the fourth quarter of 2018, compared to $22.4 million in the third quarter of 2018 and net loss from discontinued operations of $23.6 million in the fourth quarter of 2017.
Net income attributable to Daqo New Energy Corp. shareholders and earnings per ADS
As a result of the aforementioned, net income attributable to Daqo New Energy Corp. shareholders was $11.4 million in the fourth quarter of 2018, compared to net loss attributable to Daqo New Energy shareholders of $18.3 million in Q3 2018 and net income attributable to Daqo New Energy shareholders of $33.7 million in Q4 2017.
Earnings per basic American Depository Share (ADS) of $0.86 in Q4 2018, compared to loss per basic ADS of $1.39 in Q3 2018, and earnings per basic ADS of $3.16 in Q4 2017
Financial Condition
As of December 31, 2018, the Company had $94.0 million in cash and cash equivalents and restricted cash, compared to $113.2 million as of September 30, 2018 and $63.7 million as of December 31, 2017. As of December 31, 2018, the accounts receivable balance was $1.2 million, compared to $1 thousand as of September 30, 2018 and $0.7 million as of December 31, 2017. As of December 31, 2018, the notes receivable balance was $8.1 million, compared to $22.5 million as of September 30, 2018 and $20.8 million as of December 31, 2017. As of December 31, 2018, total borrowings were $171.5 million, of which $133.3 million were long-term borrowings, compared to total borrowings of $165.3 million, including $119.4 million long-term borrowings, as of September 30, 2018 and total borrowings of $185.2 million, including $111.4 million long-term borrowings, as of December 31, 2017.
Cash Flows
For the twelve months ended December 31, 2018, net cash provided by operating activities was $95.6 million, compared to $142.7 million in the same period of 2017.
For the twelve months ended December 31, 2018, net cash used in investing activities was $164.7 million, compared to $67.9 million in the same period of 2017. The net cash used in investing activities in 2018 and 2017 was primarily related to the capital expenditure on Xinjiang Phase 3B and 4A polysilicon projects.
For the twelve months ended December 31, 2018, net cash provided by financing activities was $86.7 million, compared to net cash used in financing activities of $37.4 million in the same period of 2017. The Company completed a follow-on offering of $110 million in April 2018.
Full Year 2018 Results
Revenues
Revenues were $301.6 million in 2018, compared to$323.2 million in 2017. The decrease in revenues was primarily due to lower ASPs, partially offset by polysilicon sales volumes.
Gross profit and margin
Gross profit was $98.1 million in 2018, compared to $144.0 million in 2017. Gross margin was 32.5% in 2018, compared to 44.6% in 2017. The decrease in gross profit and gross margin was primarily due to lower polysilicon ASPs despite our achievement in cost reduction.
Selling, general and administrative expenses
Selling, general and administrative expenses were $27.1 million in 2018, compared to $16.0 million in 2017. The increase in selling, general and administrative expenses was primarily due to an increase of non-cash share-based compensation costs related to the Company’s 2018 share incentive plan.
Research and development expenses
Research and development (R&D) expenses were $2.7 million in 2018, compared to $0.7 million in 2017. Research and development expenses could vary from period to period and reflect R&D activities that took place during the period.
Other operating income
Other operating income was $13.2 million in 2018, compared to $3.7 million in 2017, which mainly consisted of unrestricted cash incentives that we received from local government authorities, which could vary from period to period at the discretion of the government.
Income from operations and operating margin
As a result of the foregoing, income from operations was $81.5 million in 2018, compared to $131.1 million in 2017. Operating margin was 27.0% in 2018, compared to 40.6% in 2017.
Interest expense
Interest expense was $10.8 million in 2018, compared to $16.3 million in 2017.
Income tax expense
Income tax expenses were $11.7 million in 2018, compared to $17.3 million in 2017. The decrease was primarily due to lower income before income taxes.
Net income attributable to Daqo New Energy Corp. shareholders and earnings per ADS
Net income attributable to Daqo New Energy Corp. shareholders of $38.1 million in 2018, compared to $92.8 million in 2017. Earnings per basic ADS were $3.06 in 2018, compared to $8.76 in 2017.
Adjusted net income (non-GAAP) attributable to Daqo New Energy Corp. shareholders was $71.6 million in 2018, compared to $99.5 million in 2017. Adjusted earnings per basic ADS (non-GAAP) were of $5.74 in 2018, compared to $9.38 in 2017.
Corporate Developments
The operational results of the Chongqing business have been excluded from the Company’s financial results from continuing operations and have been separately presented under discontinued operations. Retrospective adjustments to the historical statements have also been made to provide a consistent basis of comparison for the financial results. Going forward, the Company will focus all of its resources and expertise on its core polysilicon manufacturing business.
Use of Non-GAAP Financial Measures
To supplement Daqo New Energy’s consolidated financial results presented in accordance with United States Generally Accepted Accounting Principles (“US GAAP”), the Company uses certain non-GAAP financial measures that are adjusted for certain items from the most directly comparable GAAP measures including earnings before interest, taxes, depreciation and amortization (“EBITDA”) and EBITDA margin; adjusted net income attributable to Daqo New Energy Corp. shareholders and adjusted earnings per basic ADS. Our management believes that each of these non-GAAP measures is useful to investors, enabling them to better assess changes in key element of the Company’s results of operations across different reporting periods on a consistent basis, independent of certain items as described below. Thus, our management believes that, used in conjunction with US GAAP financial measures, these non-GAAP financial measures provide investors with meaningful supplemental information to assess the Company’s operating results in a manner that is focused on its ongoing, core operating performance. Our management uses these non-GAAP measures internally to assess the business, its financial performance, current and historical results, as well as for strategic decision-making and forecasting future results. Given our management’s use of these non-GAAP measures, the Company believes these measures are important to investors in understanding the Company’s operating results as seen through the eyes of our management. These non-GAAP measures are not prepared in accordance with US GAAP or intended to be considered in isolation or as a substitute for the financial information prepared and presented in accordance with US GAAP; the non-GAAP measures should be reviewed together with the US GAAP measures, and may be different from non-GAAP measures used by other companies.
The Company uses EBITDA, which represents earnings before interest, taxes, depreciation and amortization, and EBITDA margin, which represents the proportion of EBITDA in revenues. Adjusted net income attributable to Daqo New Energy Corp. shareholders and adjusted earnings per basic ADS exclude costs related to the non-operational polysilicon assets in Chongqing. Such costs mainly consist of non-cash depreciation costs, as well as utilities and maintenance costs associated with the temporarily idle polysilicon machinery and equipment, and the Company had removed this adjustment from the non-GAAP reconciling item since Q4, since as of the end of Q3, all of the polysilicon machinery and equipment had been either relocated to Xinjiang, disposed, or planned to dispose. Adjusted net income attributable to Daqo New Energy Corp. shareholders and adjusted earnings per basic ADS also exclude costs related to share-based compensation. Share-based compensation is a non-cash expense that varies from period to period. As a result, our management excludes this item from its internal operating forecasts and models. Long-lived assets impairment during the year of 2018 is a non-cash write-off related to the discontinued solar wafer and polysilicon manufacturing facilities in Chongqing. As a result, our management excludes these items from its internal operating forecasts and models. Our management believes that this adjustment for share-based compensation and long-lived assets impairment related to the discontinued operations provides investors with a basis to measure the Company’s core performance, including compared with the performance of other companies, without the period-to-period variability created by share-based compensation.
A reconciliation of non-GAAP financial measures to comparable US GAAP measures is presented later in this document.
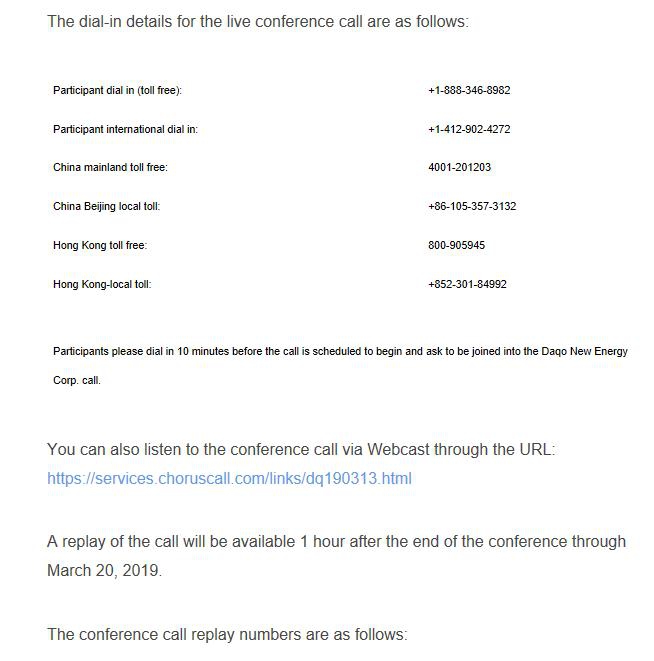
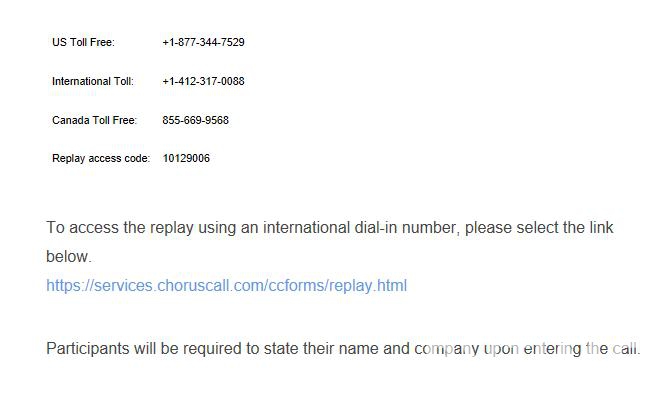
Conference Call
The Company has scheduled a conference call to discuss the results at 8:00 AM Eastern Time on March 13, 2019. (8:00 PM Beijing / Hong Kong time on the same day).
About Daqo New Energy Corp.
Daqo New Energy Corp. (NYSE: DQ) (“Daqo” or the “Company) is a leading manufacturer of high-purity polysilicon for the global solar PV industry. Founded in 2008, the Company is one of the world’s lowest cost producers of high-purity polysilicon. Daqo’s highly-efficient and technically advanced manufacturing facility in Xinjiang, China currently has a nameplate annual polysilicon production capacity of 30,000 metric tons, and the Company is undergoing a debottlenecking project and a capacity expansion project and expects to increase its annual polysilicon production capacity to 70,000 metric tons in the first quarter of 2020.
For more information, please visit http://daqo.gotoip1.com/
Safe Harbor Statement
This announcement contains forward-looking statements. These statements are made under the “safe harbor” provisions of the U.S. Private Securities Litigation Reform Act of 1995. These forward-looking statements can be identified by terminology such as “will,” “expects,” “anticipates,” “future,” “intends,” “plans,” “believes,” “estimates” and similar statements. Among other things, the outlook for the first quarter of 2019 and quotations from management in this announcement, as well as Daqo New Energy’s strategic and operational plans, contain forward-looking statements. The Company may also make written or oral forward-looking statements in its reports filed or furnished to the U.S. Securities and Exchange Commission, in its annual reports to shareholders, in press releases and other written materials and in oral statements made by its officers, directors or employees to third parties. Statements that are not historical facts, including statements about the Company’s beliefs and expectations, are forward-looking statements. Forward-looking statements involve inherent risks and uncertainties. A number of factors could cause actual results to differ materially from those contained in any forward-looking statement, including but not limited to the following: the demand for photovoltaic products and the development of photovoltaic technologies; global supply and demand for polysilicon; alternative technologies in cell manufacturing; the Company’s ability to significantly expand its polysilicon production capacity and output; the reduction in or elimination of government subsidies and economic incentives for solar energy applications; and the Company’s ability to lower its production costs. Further information regarding these and other risks is included in the reports or documents the Company has filed with, or furnished to, the Securities and Exchange Commission. All information provided in this press release is as of the date hereof, and the Company undertakes no duty to update such information or any forward-looking statement, except as required under applicable law


 today announced its unaudited financial results for the fourth quarter and fiscal year of 2018. Fourth Quarter 2018 Financial and Operating Highlights Polysilicon…)