Revenues Improve but Remain Below 2007 Peak
Worldwide silicon wafer area shipments in 2018 increased 8 percent year-over-year to a record high, while 2018 worldwide silicon revenue jumped 31 percent during the same period, topping the $10 billion mark for the first time since 2008, reported the SEMI Silicon Manufacturers Group (SMG) in its year-end analysis of the silicon wafer industry.
Silicon wafer area shipments in 2018 totaled 12,732 million square inches (MSI), up from the previous market high of 11,810 million square inches shipped during 2017. Revenues totaled $11.38 billion, compared to the $8.71 billion posted in 2017.
“For the fifth year in a row, annual semiconductor silicon volume shipments reached record levels,” said Neil Weaver, chairman of SEMI SMG, and Director, Product Development and Applications Engineering, at Shin-Etsu Handotai America. “Despite strong demand and the impressive gain in revenues last year, the market still remains below the market high set in 2007.”
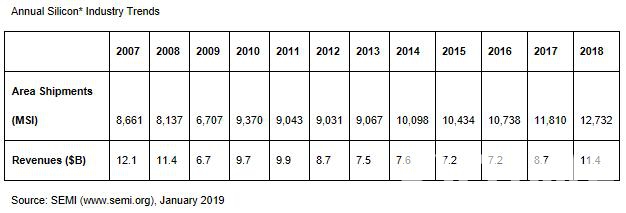
*Total Electronic Grade Silicon Slices Excluding Non-Polished Wafers. Shipments are for semiconductor applications only and do not include solar applications.
*Shipments are for semiconductor applications only and do not include solar applications
All data cited in this release includes polished silicon wafers, such as virgin test wafers and epitaxial silicon wafers, as well as non-polished silicon wafers shipped to end users.
Silicon wafers are the fundamental building material for semiconductors, which, in turn, are vital components of virtually all electronics goods, including computers, telecommunications products, and consumer electronics. The highly engineered thin, round disks are produced in various diameters – from one inch to 12 inches – and serve as the substrate material on which most semiconductor devices, or chips, are fabricated.
The Silicon Manufacturing Group (SMG) is a sub-committee of the SEMI Electronic Materials Group (EMG) and is open to SEMI members involved in manufacturing polycrystalline silicon, monocrystalline silicon or silicon wafers (e.g., as cut, polished, epi, etc.). The purpose of the group is to facilitate collective efforts on issues related to the silicon industry including the development of market information and statistics about the silicon industry and the semiconductor market.
| 2000 | Q1 1,274 | Q2 1,373 | Q3 1,457 | Q4 1,448 |
| 2001 | Q1 1,250 | Q2 988 | Q3 824 | Q4 878 |
| 2002 | Q1 1,011 | Q2 1,273 | Q3 1,263 | Q4 1,134 |
| 2003 | Q1 1,175 | Q2 1,273 | Q3 1,307 | Q4 1,392 |
| 2004 | Q1 1,529 | Q2 1,619 | Q3 1,629 | Q4 1,486 |
| 2005 | Q1 1,465 | Q2 1,606 | Q3 1,748 | Q4 1,826 |
| 2006 | Q1 1,884 | Q2 1,966 | Q3 2,074 | Q4 2,070 |
| 2007 | Q1 2,100 | Q2 2,201 | Q3 2,174 | Q4 2,185 |
| 2008 | Q1 2,163 | Q2 2,303 | Q3 2,243 | Q4 1,428 |
| 2009 | Q1 940 | Q2 1,686 | Q3 1,972 | Q4 2,109 |
| 2010 | Q1 2,214 | Q2 2,365 | Q3 2,489 | Q4 2,302 |
| 2011 | Q1 2,287 | Q2 2,393 | Q3 2,354 | Q4 2,009 |
| 2012 | Q1 2,033 | Q2 2,447 | Q3 2,389 | Q4 2,162 |
| 2013 | Q1 2,128 | Q2 2,390 | Q3 2,341 | Q4 2,208 |
| 2014 | Q1 2,363 | Q2 2,587 | Q3 2,597 | Q4 2,550 |
| 2015 | Q1 2,637 | Q2 2,702 | Q3 2,591 | Q4 2,504 |
| 2016 | Q1 2,538 | Q2 2,706 | Q3 2,730 | Q4 2,764 |
| 2017 | Q1 2,858 | Q2 2,978 | Q3 2,997 | Q4 2,977 |
| 2018 | Q1 3,084 | Q2 3,160 | Q3 3,255 | Q4 3,224 |


