

Hanwha SolarOne Co., Ltd. (“SolarOne” or the “Company”) (Nasdaq: HSOL), a vertically integrated manufacturer of silicon ingots, wafers and photovoltaic (“PV”) cells and modules in China, today reported its unaudited financial results for the quarter ended December 31, 2012. The Company will host a conference call to discuss the results at 8:00 am Eastern Time (8:00 pm Shanghai Time) on March 18, 2012. A slide presentation with details of the results will also be available on the Company’s website prior to the call.
FOURTH QUARTER 2012 HIGHLIGHTS
- Total net revenues were RMB836.7 million (US$134.3 million), a decrease of 13.4% from 3Q12, and a decrease of 14.5% from 4Q11.
- PV module shipments, including module processing services, were 198.9 MW, a decrease of 17.0% from 239.5 MW in 3Q12, and an increase of 5.2% from 189.1 MW in 4Q11.
- Average selling price (“ASP”), excluding module processing services, decreased to RMB3.75 per watt(US$0.60) from RMB4.22 per watt in 3Q12, and decreased from RMB6.29 per watt in 4Q11.
- The Company recorded certain non-cash charges totaling RMB377.5 million (US$60.6 million), includingRMB53.9 million (US$8.6 million) from inventory write-down, RMB87.6 million (US$14.1 million) from provisions for doubtful debt of accounts receivable and RMB236.0 million (US$37.9 million) from provisions for advance payments on the Company’s purchase commitment under long-term supply contracts.
- Gross loss was RMB261.8 million (US$42.0 million), compared with gross loss of RMB56.1 million in 3Q12 and gross loss of RMB604.6 million in 4Q11.
- Gross margin decreased to negative 31.3%, compared with negative 5.8% in 3Q12, due to both the lower ASP and the non-cash charges from inventory write-down and provisions for advance payments associated with long-term supply contracts. Gross margin in 4Q11 was negative 61.8%. Gross margin excluding the aforementioned provisions would have been negative 2.6% in 4Q12.
- Operating loss increased by 149.1% to RMB625.8 million (US$100.4 million) from an operating loss ofRMB251.2 million in 3Q12, compared to an operating loss of RMB1, 005.2 million in 4Q11. The increase in operating loss in 4Q12 from 3Q12 was primarily due to the significantly higher gross loss and non-cash charge from provisions for doubtful debt of accounts and advance payments on the Company’s purchase commitment under long-term supply contracts..
- Operating margin decreased to negative 74.8% from negative 26.0% in 3Q12, compared with negative 102.8% in 4Q11.
- Net loss attributable to shareholders on a non-GAAP basis[1] was RMB650.6 million (US$104.4 million), compared with net loss of RMB301.9 million in 3Q12 and net loss of RMB862.3 million in 4Q11.
- Net loss per basic ADS on a non-GAAP basis was RMB7.70 (US$1.24), compared with net loss per basic ADS on a non-GAAP basis of RMB3.57 in 3Q12 and net loss per ADS on a non-GAAP basis of RMB10.22 in 4Q11.
- Net loss attributable to shareholders on a GAAP basis was RMB670.4 million (US$107.6 million), compared with net loss attributable to shareholders on a GAAP basis of RMB322.1 million in 3Q12. The Company recorded a non-cash gain of RMB1.4 million (US$0.2 million) from the change in fair value of the convertible feature of the Company’s convertible bonds as compared to a non-cash gain of RMB1.2 million in 3Q12. Net loss attributable to shareholders on a GAAP basis in 4Q11 was RMB832.9 million, including a non-cash gain of RMB33.2 million from the change in fair value of the convertible feature of the Company’s convertible bonds. As explained in prior quarters, the fluctuations in the fair value of the convertible feature of the Company’s convertible bonds are primarily due to changes in the Company’s ADS price, over which the Company has no direct control, and does not reflect the operating performance of the Company.
- Net loss per basic ADS on a GAAP basis was RMB7.93 (US$1.27), compared with net loss per basic ADS on a GAAP basis of RMB3.81 in 3Q12 and net loss per basic ADS on a GAAP basis of RMB9.88 in 4Q11.
- Annualized Return on Equity (“ROE”) on a non-GAAP basis was negative 97.6% in 4Q12, compared with negative 38.5% in 3Q12 and negative 81.5% in 4Q11.
- Annualized ROE on a GAAP basis was negative 87.0% in 4Q12, compared to negative 36.0% in 3Q12 and negative 70.6% in 4Q11.
FULL YEAR 2012 HIGHLIGHTS
- Total net revenues were RMB3, 678.4 million (US$590.4 million), representing a decrease of 42.7% fromRMB6,416.5 million in 2011.
- PV module shipments, including module processing services, reached 829.8 MW, representing a decrease of 1.7% from 844.4 MW in 2011. Module processing services accounted for 4.7% of total revenues in 2012.
- The Company recorded total non-cash charges of RMB649.7 million (US$104.3 million), includingRMB326.1 million (US$52.3 million) from inventory write-down as a result of a lower of cost or market assessment and a regular provision for obsolescence, RMB236.0 million (US$37.9 million) from provisions for advance payments associated with long-term supply contracts, RMB87.6 million (US$14.1 million) from provisions for doubtful debt of accounts receivable and RMB 512.0 million (US$ 82.2 million) was recognized in cost of revenues and RMB137.7 million (US$ 22.1 million) in operating expenses.
- Gross loss in 2012 was RMB325.5 million (US$52.2 million), compared with a gross loss of RMB217.1 million in 2011.
- Gross margin was negative 8.8%, compared with negative 3.4% in 2011.
- Operating loss for 2012 was RMB1, 180.6 million (US$189.5 million), compared with an operating loss ofRMB1, 096.4 million in 2011.
- Operating margin was negative 32.1%, compared with negative 17.1% in 2011.
- Net loss attributable to shareholders on a non-GAAP basis1 was RMB1, 468.3 million (US$235.7 million), compared with net loss attributable to shareholders of RMB1, 068.5 million in 2011.
- Net loss per basic ADS on a non-GAAP basis was RMB17.39 (US$1.62), compared with net loss per basic ADS of RMB12.71 in 2011.
- Net loss attributable to shareholders on a GAAP basis was RMB1, 562.9 million (US$250.9 million), compared with net loss attributable to shareholders of RMB930.1 million in 2011.
- Net loss per basic ADS on a GAAP basis was RMB18.51 (US$2.97), compared with net loss per basic ADS of RMB11.06 in 2011.
- ROE on a non-GAAP basis was negative 47.8% in 2012, compared with negative 24.8% in 2011.
- ROE on a GAAP basis was negative 44.3% in 2012, compared with negative 19.6% in 2011.
| [1] | All non-GAAP numbers used in this press release exclude the accounting impact from the adoption of ASC 815-40, which relates to the accounting treatment for the convertible bonds. Please refer to the attached financial statements for the reconciliation between the GAAP and non-GAAP financial results. |
Mr. Ki-Joon HONG, Chairman and CEO of Hanwha SolarOne, commented, “The year 2012 will be remembered as one of tremendous challenge and change for the solar industry, with significant industry overcapacity and regulatory changes in key markets leading to a slowdown in demand, accompanied by rapidly decelerating prices. Almost all companies, including ours, found it virtually impossible to record profitability in such an operating environment. In spite of the degrading operating environment we faced, our company made significant progress in a number of areas; including bringing greater balance between our OEM model and branded one, diversifying our sales base into new emerging growth markets, improving our non-poly processing cost structure to be competitive with industry leaders, instituted operational efficiencies at our manufacturing sites including enhanced automation, better quality, improved product features and new product introductions, and secured financing from a variety of sources both within and outside mainland China.”
Chairman HONG continued ” Our volumes in the fourth quarter did not reflect the improving demand environment of late as we chose to sacrifice sales at loss making prices and our profitability was impacted by a number of non-cash charges. However, we are well on track to achieving 50% improvement in first quarter 2013 shipment volume and over 50% for the full year. We have good visibility in South Africa and Japan for the first half of this year in particular, and continue to see growing opportunities in China, the US, the Middle East and other emerging markets of importance. Our funding for 2013 is proceeding as planned. Industry prices seem to have stabilized, and we see good opportunities to exploit synergies with our sister company Hanwha Q.CELLS, including a sizeable module tolling business. Profitability will remain challenging for most, if not all of 2013, but we feel confident that we are making good progress on the return to a path of profitability, aided by forecasted improvements in the operating environment and securing the company to challenge for industry leadership longer term.”
FOURTH QUARTER 2012 RESULTS
- Total net revenues were RMB836.7 million (US$134.3 million), a decrease of 13.4% from RMB966.1 millionin 3Q12, and a decrease of 14.5% from RMB978.3 million in 4Q11. The decrease in total net revenues in 4Q12 compared with 3Q12 was primarily due to lower shipments and reduced ASP.
- PV module shipments, including module processing services, were 198.9 MW, a decrease from 239.5 MW in 3Q12, and an increase from 189.1 MW in 4Q11.

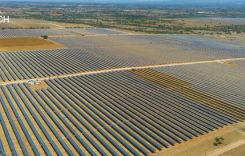
Module revenue by shipping destination Q4 12. (PRNewsFoto/Hanwha SolarOne Co., Ltd.)

- Module shipments to Japan grew from 3% in 3Q12 to 20% in 4Q12 at a good pricing level. The China market remained solid for the Company and increased from 11% in 3Q12 to 15% of module shipments in 4Q12. The dispersion of shipments this quarter saw relatively new and potentially attractive markets come to the forefront with large contributions from Greece (16%), Thailand (8%) and India (6%). Historically strong markets accounted for a smaller proportion of shipments as a result of the aforementioned; shipments fromGermany declined to 8% from 39% in 3Q12 as the full effect of the July 1 incentives reductions were felt and the US decreased to 6% this quarter. In 2012, shipments to Europe and Africa (EA) contributed 62% to total module shipments with Asian Pacific (AP) accounting for 24% and North America (NA) 8%.
- Average selling price (“ASP”), excluding module processing services, decreased to RMB3.75 per watt(US$0.60) from RMB4.22 per watt in 3Q12 and from RMB6.29 per watt in 4Q11.
- Gross loss of 4Q12 was RMB261.8 million (US$42.0 million), compared with a gross loss of RMB56.1 million in 3Q12 and a gross loss of RMB604.6 million in 4Q11.
- Gross margin decreased to negative 31.3%, compared with negative 5.8% in 3Q12, due to both the lower ASP and the non-cash charges from inventory write-down and provisions for advance payments on the Company’s purchase commitment under long-term supply contracts. Gross margin in 4Q11 was negative 61.8%.
- The blended cost of goods sold (“COGS”) per watt, excluding module processing services, was US$0.81(including $0.17 non-cash charges from inventory write-down and provisions for advance payments associated with long-term supply contract), representing a 14.1% increase from US$0.71 in 3Q12. The blended COGS takes into account the production cost (silicon and non-silicon) using internally sourced wafers, purchase costs and additional processing costs of externally sourced wafers and cells. Excluding non-cash charges, the Company would have achieved a 9.9% reduction in blended COGS to $0.64.
- Operating loss of 4Q12 was RMB625.8 million (US$100.4 million), compared with an operating loss ofRMB251.2 million in 3Q12 and an operating loss of RMB1, 005.2 million in 4Q11. Operating margin decreased to negative 74.8% from negative 26.0% in 3Q12, compared to negative 102.8% in 4Q11.
- Operating expenses as a percentage of total net revenues were 43.5% in 4Q12, compared with 20.2% in 3Q12 and 40.9% in 4Q11. The higher operating expenses in 4Q12 compared with 3Q12 was primarily due to non-cash charges from provisions for doubtful debt of accounts receivable and decrease in revenue.
- Interest expense was RMB73.9 million (US$11.9 million), compared with RMB79.9 million in 3Q12 andRMB41.7 million in 4Q11.
- The Company recorded a net gain of RMB19.0 million (US$3.0 million), which combined a foreign exchange gain with a loss from the change in fair value of derivatives. The Company recorded a net gain of RMB18.1 million in 3Q12 and a net loss of RMB0.1 million in 4Q11 for the foreign exchange gain/loss and the gain/loss from change in fair value of derivatives.
- Gain from the change in fair value of the conversion feature of the Company’s convertible bonds was RMB1.4 million (US$0.2 million), compared with RMB1.2 million in 3Q12 and RMB33.2 million in 4Q11. The fluctuations resulting from the adoption of ASC 815-40 on January 1, 2009, were primarily due to changes in the Company’s ADS price during the quarter. This line item has fluctuated, and is expected to continue to fluctuate quarter-to-quarter. The Company has no direct control over the fluctuations.
- Income tax benefit in 4Q12 increased to RMB9.1 million (US$1.5 million), compared with RMB15.8 million in 3Q12 and RMB179.9 million in 4Q11.
- Net loss attributable to shareholders on a non-GAAP basis1 was RMB650.6 million (US$104.4 million), compared with a net loss attributable to shareholders of RMB301.9 million in 3Q12 and a net loss attributable to shareholders of RMB862.3 million in 4Q11.
- Net loss per basic ADS on a non-GAAP basis was RMB7.70 (US$1.24), compared with net loss per basic ADS on a non-GAAP basis of RMB3.57 in 3Q12 and net loss per basic ADS on a non-GAAP basis ofRMB10.22 in 4Q11.
- Net loss attributable to shareholders on a GAAP basis was RMB670.4 million (US$107.6 million), compared with net loss attributable to shareholders of RMB322.1 million in 3Q12 and net loss attributable to shareholders of RMB832.9 million in 4Q11.
- Net loss per basic ADS on a GAAP basis was RMB7.93 (US$1.27), compared with net loss per basic ADS ofRMB3.81 in 3Q12 and net loss per basic ADS of RMB9.88 in 4Q11.
- Annualized ROE on a non-GAAP basis was negative 97.6% in 4Q12, compared with negative 38.5% in 3Q12 and negative 81.5% in 4Q11.
- Annualized ROE on a GAAP basis was negative 87.0% in 4Q12, compared with negative 36.0% in 3Q12 and negative 70.6% in 4Q11.
FINANCIAL POSITION
As of December 31, 2012, the Company had cash and cash equivalents of RMB676.5 million (US$108.6 million) and net working capital of RMB44.3 million (US$7.1 million), compared with cash and cash equivalents ofRMB1,607.2 million and net working capital of RMB915.4 million as of September 30, 2012. Total short-term bank borrowings (including the current portion of long-term bank borrowings) were RMB1, 629.6 million (US$261.6 million), compared with RMB1, 917.7 million as of September 30, 2012.
As of December 31, 2012, the Company had total long-term debt of RMB2, 653.7 million (US$425.9 million), which comprised both long-term bank borrowings and convertible notes payable. The Company’s long-term bank borrowings are to be repaid in installments until their maturities ranging from 2 to 4 years. Holders of the convertible notes have the option to require the Company to redeem the notes beginning on January 15, 2015.
Net cash used in operating activities in 4Q12 was RMB440.7 million (US$70.7 million), compared with net cash used in operating activities of RMB322.1 million in 3Q12 and net cash generated from operating activities ofRMB311.3 million in 4Q11.
As of December 31, 2012, accounts receivable were RMB957.0 million (US$153.6 million), compared withRMB1, 154.6 million as of September 30, 2012 and RMB537.5 million as of December 31, 2011. Day’s sales outstanding (DSO) increased to 164 days in 4Q12 from 126 days in 3Q12 and 82 days in 4Q11. The decline in receivables from 3Q12 to 4Q12 reflects lower shipments and revenues. The increase in DSO reflects longer credit terms to meet industry competitive standards. As of December 31, 2012, inventories increased toRMB838.7 million (US$134.6 million) from RMB757.0 million as of September 30, 2012, and from RMB684.0 million as of December 31, 2011. Day’s inventory was 65 days in 4Q12 compared with 63 days in 3Q12 and 53 days in 4Q11.
Capital expenditures were RMB71.4 million (US$11.5 million) in 4Q12. For full year 2012, total capital expenditures were RMB598.0 million (US$96.0 million).
The Company has from time to time been buying back its convertible bonds since January 1, 2012 and may do so in the future, subject to market conditions and other factors. The Company has purchased approximately $72 million out of US$172.5 million in face value.
CAPACITY EXPANSION
As of December 31, 2012, the Company had production capacities of 800 MW for ingot and wafer, 1.3 GW for cell and 1.5 GW for module. The Company currently has no near-term plan to add additional capacities. Management will review expansion needs in the future in line with changes in overall market demand.
BUSINESS OUTLOOK
- The Company provides the following guidance based on current operating trends and market conditions.
For the first quarter 2013 the Company expects:
- Module shipments 300MW or above.
For the full year 2013, the Company expects:
- Module shipments between 1.3-1.5GW of which about 30-35% will be for PV module processing services.
- Capital expenditures of $50 million depending on demand and other market conditions.
CONFERENCE CALL
The Company will host a conference call to discuss the fourth quarter and full year of 2012 results at 8:00 AM Eastern Time (8:00 PM Shanghai Time) on March 18, 2013.
Mr. Ki-Joon HONG, Chairman and CEO; Mr. MinSu KIM, President; Mr. Dong Kwan KIM, Chief Strategy Officer; Mr. Jung Pyo SEO, Chief Financial Officer; and Mr. Paul Combs, Vice President of Investor Relations, will discuss the results and take questions following the prepared remarks.
The dial-in details for the live conference call are as follows:
| U.S. Toll Free Number: | 1 866 519 4004 |
| U.S. New York local number: | 1 718 354 1231 |
| International dial-in number: | +65 6723 9381 |
| China Toll Free Number: | 800 819 0121 |
| 400 620 8038 | |
| Passcode: | HSOL |
A live webcast of the conference call will be available on the investor relations section of the Company’s website at: http://www.hanwha-solarone.com. A replay of the webcast will be available for one month.
A telephone replay of the call will be available for seven days after the conclusion of the conference call. The dial-in details for the replay are as follows:
| U.S. Toll Free Number: | 1 866 214 5335 |
| International dial-in number: | +1 612 8235 5000 |
| Pass code: | 55275126 |
FOREIGN CURRENCY CONVERSION
The conversion in this release of Renminbi into U.S. dollars is made solely for the convenience of the reader, and is based on the exchange rate as set forth in the H.10 statistical release of the Federal Reserve Board as ofDecember 31, 2012, which was RMB6.2301 to US$1.00. No representation is intended to imply that the Renminbi amounts could have been, or could be, converted, realized or settled into U.S. dollars at that rate onDecember 31, 2012 or at any other date. The percentages stated in this press release are calculated based on Renminbi amounts.
USE OF NON-GAAP FINANCIAL MEASURES
The Company has included in this press release certain non-GAAP financial measures, including certain line items presented on the basis that the accounting impact of ASC 815-40 had not been recorded. The Company believes that both management and investors benefit from referring to these non-GAAP financial measures in assessing the performance of the Company and when planning and forecasting future periods. Readers are cautioned not to view non-GAAP financial measures on a stand-alone basis or as a substitute for GAAP measures, or as being comparable to results reported or forecasted by other companies, and should refer to the reconciliation of GAAP measures with non-GAAP measures also included herein.
SAFE HARBOR STATEMENT
This press release contains forward-looking statements. These statements constitute “forward-looking” statements within the meaning of Section 27A of the Securities Act of 1933, as amended, and Section 21E of the Securities Exchange Act of 1934, as amended, and as defined in the U.S. Private Securities Litigation Reform Act of 1995. These forward-looking statements include 1Q and full-year 2012 estimates for PV product shipments, ASPs, production capacities and other results of operations. Forward-looking statements involve inherent risks and uncertainties and actual results may differ materially from such estimates depending on future events and other changes in business climate and market conditions. Hanwha SolarOne disclaims any obligation to update or correct any forward-looking statements.
About Hanwha SolarOne
Hanwha SolarOne Co., Ltd. (NASDAQ: HSOL) is a vertically-integrated manufacturer of silicon ingots, wafers, PV cells and modules. Hanwha SolarOne offers high-quality, reliable products and services at competitive prices. Partnering with third-party distributors, OEM manufacturers, and systems integrators, Hanwha SolarOne serves the utility, commercial, government, and residential markets. The Company maintains a strong presence worldwide, with employees located throughout Europe, North America and Asia, and embraces environmental responsibility and sustainability, with an active role in the voluntary photovoltaic recycling program. Hanwha Group, Hanwha SolarOne’s largest shareholder, is active in solar project development and financing, and plans to produce polysilicon in the future. For more information, please visit: http://www.hanwha-solarone.com
Financial Statements
| Hanwha SolarOne Co., Ltd. | ||||||||||||||||||||||||||||||||||
| CONSOLIDATED BALANCE SHEETS | ||||||||||||||||||||||||||||||||||
| (Amounts in thousands of Renminbi (“RMB”) and U.S. dollars (“US$”) | ||||||||||||||||||||||||||||||||||
| December 31 | September 31 | December 31 | December 31 | |||||||||||||||||||||||||||||||
| 2011 | 2012 | 2012 | 2012 | |||||||||||||||||||||||||||||||
| (Audited) | (Unaudited) | (Unaudited) | (Unaudited) | |||||||||||||||||||||||||||||||
| RMB’000 | RMB’000 | RMB’000 | US$’000 | |||||||||||||||||||||||||||||||
| ASSETS | ||||||||||||||||||||||||||||||||||
| Current assets | ||||||||||||||||||||||||||||||||||
| Cash and cash equivalents | 1,976,555 | 1,607,164 | 676,476 | 108,582 | ||||||||||||||||||||||||||||||
| Restricted cash | 281,626 | 228,132 | 150,462 | 24,151 | ||||||||||||||||||||||||||||||
| Derivative contracts | 29,091 | – | – | – | ||||||||||||||||||||||||||||||
| Accounts receivable, net | 537,540 | 1,154,597 | 956,969 | 153,604 | ||||||||||||||||||||||||||||||
| Notes receivable | 60,208 | 5,429 | 2,681 | 430 | ||||||||||||||||||||||||||||||
| Inventories, net | 684,049 | 756,966 | 838,727 | 134,625 | ||||||||||||||||||||||||||||||
| Advance to suppliers, net | 475,645 | 401,675 | 166,838 | 26,779 | ||||||||||||||||||||||||||||||
| Other current assets | 528,572 | 344,587 | 356,784 | 57,268 | ||||||||||||||||||||||||||||||
| Deferred tax assets – net | 264,590 | 249,136 | 150,297 | 24,124 | ||||||||||||||||||||||||||||||
| Amount due from related parties | 241,453 | 422,205 | 420,610 | 67,513 | ||||||||||||||||||||||||||||||
| Total current assets | 5,079,329 | 5,169,891 | 3,719,844 | 597,076 | ||||||||||||||||||||||||||||||
| Non-current assets | ||||||||||||||||||||||||||||||||||
| Fixed assets – net | 4,715,962 | 4,784,458 | 4,779,873 | 767,222 | ||||||||||||||||||||||||||||||
| Intangible assets – net | 334,987 | 336,819 | 335,047 | 53,779 | ||||||||||||||||||||||||||||||
| Deferred tax assets – net | 16,493 | 8,237 | 107,304 | 17,224 | ||||||||||||||||||||||||||||||
| Long-term deferred expenses | 49,702 | 29,854 | 25,200 | 4,045 | ||||||||||||||||||||||||||||||
| Long-term prepayment | 204,570 | 176,884 | 184,065 | 29,544 | ||||||||||||||||||||||||||||||
| Total non-current assets | 5,321,714 | 5,336,252 | 5,431,489 | 871,814 | ||||||||||||||||||||||||||||||
| TOTAL ASSETS | 10,401,043 | 10,506,143 | 9,151,333 | 1,468,890 | ||||||||||||||||||||||||||||||
| LIABILITIES | ||||||||||||||||||||||||||||||||||
| Current liabilities | ||||||||||||||||||||||||||||||||||
| Derivative contracts | 30,670 | 13,834 | 17,311 | 2,779 | ||||||||||||||||||||||||||||||
| Short-term bank borrowings | 1,764,251 | 1,459,990 | 1,162,372 | 186,574 | ||||||||||||||||||||||||||||||
| Long-term bank borrowings, current portion | 242,604 | 457,725 | 467,204 | 74,991 | ||||||||||||||||||||||||||||||
| Accounts payable | 1,024,947 | 1,076,029 | 1,061,723 | 170,418 | ||||||||||||||||||||||||||||||
| Notes payable | 462,602 | 641,135 | 314,517 | 50,483 | ||||||||||||||||||||||||||||||
| Accrued expenses and other liabilities | 375,238 | 364,028 | 400,537 | 64,291 | ||||||||||||||||||||||||||||||
| Customer deposits | 84,871 | 46,490 | 36,314 | 5,829 | ||||||||||||||||||||||||||||||
| Unrecognized tax benefit | 143,473 | 143,473 | 143,473 | 23,029 | ||||||||||||||||||||||||||||||
| Amount due to related parties | 42,342 | 51,815 | 72,045 | 11,564 | ||||||||||||||||||||||||||||||
| Total current liabilities | 4,170,998 | 4,254,519 | 3,675,496 | 589,958 | ||||||||||||||||||||||||||||||
| Non-current liabilities | ||||||||||||||||||||||||||||||||||
| Long-term bank borrowings | 1,352,373 | 2,406,121 | 2,285,106 | 366,785 | ||||||||||||||||||||||||||||||
| Convertible bonds | 498,646 | 351,778 | 368,590 | 59,163 | ||||||||||||||||||||||||||||||
| Long term payable | 50,000 | 52,450 | 50,000 | 8,026 | ||||||||||||||||||||||||||||||
| Deferred tax liabilities | 25,387 | 24,945 | 24,798 | 3,980 | ||||||||||||||||||||||||||||||
| Total non-current liabilities | 1,926,406 | 2,835,294 | 2,728,494 | 437,954 | ||||||||||||||||||||||||||||||
| TOTAL LIABILITIES | 6,097,404 | 7,089,813 | 6,403,990 | 1,027,912 | ||||||||||||||||||||||||||||||
| Redeemable ordinary shares | 24 | 24 | 24 | 4 | ||||||||||||||||||||||||||||||
| EQUITY | ||||||||||||||||||||||||||||||||||
| Shareholders’ equity | ||||||||||||||||||||||||||||||||||
| Ordinary shares | 315 | 316 | 316 | 51 | ||||||||||||||||||||||||||||||
| Additional paid-in capital | 3,996,418 | 4,002,418 | 4,004,199 | 642,718 | ||||||||||||||||||||||||||||||
| Statutory reserves | 174,456 | 174,727 | 174,456 | 28,002 | ||||||||||||||||||||||||||||||
| Retained earnings | 132,426 | (760,294) | (1,430,433) | (229,600) | ||||||||||||||||||||||||||||||
| Accumulated other comprehensive income | – | (861) | (1,219) | (197) | ||||||||||||||||||||||||||||||
| Total shareholders’ equity | 4,303,615 | 3,416,306 | 2,747,319 | 440,974 | ||||||||||||||||||||||||||||||
| TOTAL EQUITY | 4,303,639 | 3,416,330 | 2,747,343 | 440,978 | ||||||||||||||||||||||||||||||
| TOTAL LIABILITIES, REDEEMABLE ORDINARY SHARES AND SHAREHOLDERS’ EQUITY | 10,401,043 | 10,506,143 | 9,151,333 | 1,468,890 | ||||||||||||||||||||||||||||||
| Hanwha SolarOne Co., Ltd. | ||||||||||||
| CONSOLIDATED STATEMENTS OF OPERATIONS | ||||||||||||
| (Amounts in thousands of Renminbi (“RMB”) and U.S. dollars (“US$”), | ||||||||||||
| except for number of shares (ADS) and per share (ADS) data | ||||||||||||
| For the three months ended | For the years ended | |||||||||||
| December 31 | September 30 | December 31 | December 31 | December 31 | December 31 | December 31 | ||||||
| 2011 | 2012 | 2012 | 2012 | 2011 | 2012 | 2012 | ||||||
| (Unaudited) | (Unaudited) | (Unaudited) | (Unaudited) | (Unaudited) | (Unaudited) | (Unaudited) | ||||||
| RMB’000 | RMB’000 | RMB’000 | US$’000 | RMB’000 | RMB’000 | US$’000 | ||||||
| Net revenues | 978,272 | 966,129 | 836,663 | 134,293 | 6,416,485 | 3,678,380 | 590,420 | |||||
| Cost of revenues | (1,582,900) | (1,022,182) | (1,098,413) | (176,307) | (6,633,542) | (4,003,885) | (642,667) | |||||
| – | – | – | – | – | – | – | ||||||
| Gross profit / (loss) | (604,628) | (56,053) | (261,750) | (42,014) | (217,057) | (325,505) | (52,247) | |||||
| Operating expenses | ||||||||||||
| Selling expenses | (98,185) | (98,322) | (115,663) | (18,565) | (279,788) | (348,568) | (55,949) | |||||
| G&A expenses | (145,565) | (73,807) | (221,653) | (35,578) | (396,639) | (415,707) | (66,726) | |||||
| R&D expenses | (22,071) | (23,001) | (26,709) | (4,287) | (68,217) | (90,820) | (14,578) | |||||
| Loss on goodwill impairment | (134,735) | – | (134,735) | – | – | |||||||
| – | – | – | – | – | – | – | ||||||
| Total operating expenses | (400,556) | (195,130) | (364,025) | (58,430) | (879,379) | (855,095) | (137,253) | |||||
| – | – | – | – | – | – | – | ||||||
| Operating loss | (1,005,184) | (251,183) | (625,775) | (100,444) | (1,096,436) | (1,180,600) | (189,500) | |||||
| Interest expenses | (41,732) | (79,876) | (73,927) | (11,866) | (171,059) | (299,515) | (48,075) | |||||
| Interest income | 3,207 | 5,489 | 3,237 | 520 | 11,763 | 15,841 | 2,543 | |||||
| Exchange gain (loss) | (5,029) | 25,783 | 21,669 | 3,478 | (3,965) | 8,875 | 1,425 | |||||
| Gain (loss) on change in fair value of derivative | 4,919 | (7,667) | (2,688) | (431) | (70,778) | 5,326 | 855 | |||||
| Gain (loss) on change in conversion feature fair value of convertible bond | 33,181 | 1,219 | 1,411 | 226 | 264,384 | (5,692) | (914) | |||||
| Loss on extinguishment of debt | – | (29,054) | – | – | – | (82,713) | (13,276) | |||||
| Other income | 1,808 | 2,259 | 2,739 | 440 | 5,144 | 9,265 | 1,487 | |||||
| Other expenses | (3,986) | (4,880) | (6,150) | (987) | (14,102) | (18,391) | (2,952) | |||||
| – | – | – | – | – | – | – | ||||||
| Net loss before income tax | (1,012,816) | (337,910) | (679,484) | (109,064) | (1,075,049) | (1,547,604) | (248,407) | |||||
| Income tax expenses | 179,877 | 15,776 | 9,074 | 1,456 | 144,945 | (15,255) | (2,449) | |||||
| – | – | – | – | – | – | – | ||||||
| Net loss | (832,939) | (322,134) | (670,410) | (107,608) | (930,104) | (1,562,859) | (250,856) | |||||
| – | – | – | – | – | – | – | ||||||
| Net loss attributable | ||||||||||||
| to shareholders | (832,939) | (322,134) | (670,410) | (107,608) | (930,104) | (1,562,859) | (250,856) | |||||
| Net loss per share | ||||||||||||
| Basic | (1.98) | (0.76) | (1.59) | (0.25) | (2.21) | (3.70) | (0.59) | |||||
| Diluted | (1.98) | (0.76) | (1.59) | (0.25) | (2.21) | (3.70) | (0.59) | |||||
| Shares used in computation | ||||||||||||
| Basic | 421,676,232 | 422,255,918 | 422,565,284 | 422,565,284 | 420,325,701 | 422,167,505 | 422,167,505 | |||||
| Diluted | 421,676,232 | 422,255,918 | 422,565,284 | 422,565,284 | 420,325,701 | 422,167,505 | 422,167,505 | |||||
| Net loss per ADS | ||||||||||||
| Basic | (9.88) | (3.81) | (7.93) | (1.27) | (11.06) | (18.51) | (2.97) | |||||
| Diluted | (9.88) | (3.81) | (7.93) | (1.27) | (11.06) | (18.51) | (2.97) | |||||
| ADSs used in computation | ||||||||||||
| Basic | 84,335,246 | 84,451,184 | 84,513,057 | 84,513,057 | 84,065,140 | 84,433,501 | 84,433,501 | |||||
| Diluted | 84,335,246 | 84,451,184 | 84,513,057 | 84,513,057 | 84,065,140 | 84,433,501 | 84,433,501 | |||||
| Hanwha SolarOne Co., Ltd. | |||||||||||
| CONSOLIDATED STATEMENTS OF CASH FLOWS | |||||||||||
| (Amounts in thousands of Renminbi (“RMB”) and U.S. dollars (“US$”) | |||||||||||
| For the three months ended | For the years ended | ||||||||||
| December 31, 2011 | September 30, 2012 | December 31, 2012 | December 31, 2012 | December 31, 2011 | December 31, 2012 | December 31, 2012 | |||||
| (Unaudited) | (Unaudited) | (Unaudited) | (Unaudited) | (Unaudited) | (Unaudited) | (Unaudited) | |||||
| RMB’000 | RMB’000 | RMB’000 | US$’000 | RMB’000 | RMB’000 | US$’000 | |||||
| Cash flow from operating activities | |||||||||||
| Net loss | (832,939) | (322,134) | (670,410) | (107,608) | (930,104) | (1,562,859) | (250,856) | ||||
| Adjustments to reconcile net income (loss) to net cash |
|||||||||||
| provided (used) in operating activities: | |||||||||||
| Unrealised (gain)/loss from derivative contracts | (31,154) | 10,911 | 3,477 | 558 | 1,021 | 15,732 | 2,524 | ||||
| Amortization of convertible bonds discount | 26,133 | 22,454 | 18,223 | 2,925 | 75,595 | 88,507 | 14,207 | ||||
| Changes in fair value of conversion feature of convertible bonds |
(33,181) | (1,229) | (1,411) | (226) | (264,384) | 5,692 | 914 | ||||
| Loss on extinguishment of debt | – | 29,054 | – | – | – | 82,713 | 13,276 | ||||
| Loss from disposal of fixed assets | 473 | 2,986 | 1,364 | 219 | 1,714 | 8,497 | 1,364 | ||||
| Depreciation and amortization | 52,464 | 92,769 | 107,232 | 17,211 | 218,641 | 373,155 | 59,896 | ||||
| Loss on goodwill impairment | 134,735 | – | – | – | 134,735 | – | – | ||||
| Amortization of long-term deferred expenses | 6,129 | 4,551 | 4,616 | 741 | 11,408 | 21,577 | 3,463 | ||||
| Provision for doubtful debt of advance to suppliers | 287,749 | – | 170,012 | 27,289 | 287,742 | 170,012 | 27,289 | ||||
| Provision for doubtful debt of other receivables | 54,456 | – | 50,048 | 8,033 | 54,456 | 50,048 | 8,033 | ||||
| Provision for amount due from related party | – | – | 15,960 | 2,562 | – | 15,960 | 2,562 | ||||
| Reversal of doubtful debt of advance to suppliers | – | – | – | – | – | – | – | ||||
| Provision for doubtful debt of accounts receivable | – | – | 87,626 | 14,065 | 1,778 | 87,626 | 14,065 | ||||
| Write down of inventories | 305,820 | 44,916 | 53,926 | 8,656 | 583,097 | 326,051 | 52,335 | ||||
| Stock compensation expense | 2,208 | 2,197 | 1,781 | 286 | 38,331 | 7,782 | 1,249 | ||||
| Warranty provision | 8,641 | 4,662 | 6,788 | 1,090 | 61,059 | 25,694 | 4,124 | ||||
| Warranty reversal | (7,022) | (6,688) | (389) | (62) | (30,615) | (9,958) | (1,598) | ||||
| Deferred tax benefit | (112,641) | (15,242) | (375) | (60) | (173,303) | 22,893 | 3,675 | ||||
| Unrecognized tax benefit | (26,344) | – | – | – | – | ||||||
| Changes in operating assets and liabilities | |||||||||||
| Restricted cash | 25,974 | (44,117) | 84,390 | 13,546 | (28,693) | 12,379 | 1,987 | ||||
| Inventory | 195,468 | (116,995) | (135,687) | (21,779) | (476,373) | (480,729) | (77,162) | ||||
| Account and notes receivables | 726,054 | (350,744) | 112,392 | 18,041 | 693,281 | (450,747) | (72,351) | ||||
| Advance to suppliers and long-term prepayments | 124,433 | 26,088 | 57,644 | 9,252 | 85,883 | 159,300 | 25,569 | ||||
| Long-term deferred expenses | (2,322) | – | – | – | (2,322) | (1,484) | (238) | ||||
| Intangible assets | – | – | – | – | (134,719) | (7,104) | (1,140) | ||||
| Other current assets | (128,730) | 9,550 | (62,079) | (9,965) | (206,408) | 135,524 | 21,753 | ||||
| Amount due from related parties | (144,669) | (98,377) | (14,365) | (2,306) | (198,634) | (195,117) | (31,318) | ||||
| Accounts and notes payable | (360,070) | 364,254 | (377,764) | (60,635) | 381,841 | 48,150 | 7,728 | ||||
| Accrued expenses and other liabilities | 25,049 | 31,388 | 32,706 | 5,248 | (60,025) | 17,347 | 2,784 | ||||
| Customer deposits | 25,955 | (17,414) | (10,176) | (1,633) | 51,333 | (48,557) | (7,794) | ||||
| Amount due to related parties | (11,320) | 2,640 | 26,254 | 4,214 | 29,159 | 29,703 | 4,768 | ||||
| Long-term payable | – | 2,450 | (2,450) | (393) | 50,000 | – | – | ||||
| Net cash provided (used) in operating activities | 311,349 | (322,070) | (440,667) | (70,731) | 255,494 | (1,052,213) | (168,892) | ||||
| Cash flows from investing activities | |||||||||||
| Acquisition of fixed assets | (289,902) | (80,052) | (71,423) | (11,464) | (2,400,481) | (597,978) | (95,982) | ||||
| Change of restricted cash | 27,638 | 1,472 | (5,495) | (882) | (37,443) | 63,461 | 10,186 | ||||
| Net cash provided (used) in investing activities | (262,264) | (78,580) | (76,918) | (12,346) | (2,437,924) | (534,517) | (85,796) | ||||
| Cash flows from financing activities | |||||||||||
| Proceeds from share lending | – | – | – | – | 9 | – | – | ||||
| Proceeds from exercise of stock option | – | – | – | – | 1,135 | – | – | ||||
| Payment for repurchase of redeemable oridnary shares |
(18) | – | – | – | (18) | – | – | ||||
| Payment for repurchase of convertible bonds | – | (99,440) | – | – | (16) | (299,271) | (48,036) | ||||
| Change of restricted cash | (115,000) | 417,670 | (1,225) | (197) | (115,000) | 55,324 | 8,880 | ||||
| Proceeds from short-term bank borrowings | 1,045,751 | 968,467 | 100,627 | 16,152 | 3,322,480 | 2,661,172 | 427,147 | ||||
| Proceeds from long-term bank borrowings | 116,515 | 6,457 | – | – | 1,594,977 | 1,369,370 | 219,799 | ||||
| Payment of short term bank borrowings | (886,711) | (1,029,047) | (398,245) | (63,923) | (1,877,148) | (3,263,051) | (523,756) | ||||
| Payment for long term bank borrowings | (20,000) | (38,896) | (111,536) | (17,903) | (350,000) | (212,037) | (34,034) | ||||
| Payment of arrangement fee of long-term loans | (42,586) | (5,188) | (2,596) | (417) | (42,586) | (18,355) | (2,946) | ||||
| Payment of arrangement fee of short-term loans | (5,625) | (1,474) | (128) | (21) | (5,625) | (6,501) | (1,043) | ||||
| Net cash provided (used) by financing activities | 92,310 | 218,549 | (413,103) | (66,309) | 2,528,208 | 286,651 | 46,011 | ||||
| Net increase (decrease) in cash and cash equivalents | 141,395 | (182,101) | (930,688) | (149,386) | 345,778 | (1,300,079) | (208,677) | ||||
| Cash and cash equivalents at the beginning of period | 1,835,160 | 1,789,265 | 1,607,164 | 257,968 | 1,630,777 | 1,976,555 | 317,259 | ||||
| Cash and cash equivalents at the end of period | 1,976,555 | 1,607,164 | 676,476 | 108,582 | 1,976,555 | 676,476 | 108,582 | ||||
| Supplemental disclosure of cash flow information: | |||||||||||
| Interest paid | (9,609) | 51,848 | 26,421 | 4,241 | 54,828 | 164,536 | 26,410 | ||||
| Income tax paid | 3,442 | (10,331) | 549 | 88 | 152,681 | 47,212 | 7,578 | ||||
| Realized gain/(loss) from derivative contracts | (26,235) | 3,243 | 790 | 127 | (69,757) | 21,059 | 3,380 | ||||
| Supplemental schedule of non-cash activities: | |||||||||||
| Acquisition of fixed assets included in accounts payable, accrued expenses and other liabilities |
85,371 | (30,023) | 30,816 | 4,946 | 446,314 | (159,459) | (25,595) | ||||
| For the three months ended | For the years ended | |||||||||
| December 31, 2011 | September 30, 2012 | December 31, 2012 | December 31, 2012 | December 31, 2011 | December 31, 2012 | December 31, 2012 | ||||
| (RMB million) | (RMB million) | (RMB million) | (US$ milllion) | (RMB million) | (RMB million) | (US$ milllion) | ||||
| Non-GAAP net loss | (862.3) | (301.9) | (650.6) | (104.4) | (1,068.5) | (1,468.3) | (235.7) | |||
| Fair value changes of the conversion features of the Convertible bonds | 33.3 | 1.2 | 1.4 | 0.2 | 264.4 | (5.7) | (0.9) | |||
| Accretion of interest of the Convertible bonds | (30.2) | (21.4) | (21.2) | (3.4) | (97.5) | (88.9) | (14.3) | |||
| Unrecognized tax benefit | 26.3 | – | – | – | – | – | – | |||
| Severance fee to previous senior management | – | – | – | – | (32.6) | – | – | |||
| Tax impact of severance fee to previous senior management | – | – | – | – | 4.1 | – | – | |||
| GAAP net loss | (832.9) | (322.1) | (670.4) | (107.6) | (930.1) | (1,562.9) | (250.9) | |||
| For the three months ended | For the years ended | |||||||||
| December 31, 2011 | September 30, 2012 | December 31, 2012 | December 31, 2012 | December 31, 2011 | December 31, 2012 | December 31, 2012 | ||||
| (RMB) | (RMB) | (RMB) | (US$) | (RMB) | (RMB) | (US$) | ||||
| Non GAAP net loss per ADS – Basic | (10.22) | (3.57) | (7.70) | (1.24) | (12.71) | (17.39) | (2.79) | |||
| Fair value changes of the conversion features of the Convertible bonds | 0.39 | 0.01 | 0.02 | 0.01 | 3.14 | (0.07) | (0.01) | |||
| Accretion of interest of the Convertible bonds | (0.36) | (0.25) | (0.25) | (0.04) | (1.16) | (1.05) | (0.17) | |||
| Unrecognized tax benefit | 0.31 | – | – | – | – | – | – | |||
| Severance fee to previous senior management | – | – | (0.38) | – | – | |||||
| Tax impact of severance fee to previous senior management | – | – | 0.05 | – | – | |||||
| Net loss contributed to shareholders per ADS – Basic | (9.88) | (3.81) | (7.93) | (1.27) | (11.06) | (18.51) | (2.97) | |||
| ADS (Basic) | 84,335,246 | 84,451,184 | 84,513,057 | 84,513,057 | 84,065,140 | 84,433,501 | 84,433,501 | |||
| For thee months ended | Annualized for the three months ended | For the twelve months ended | For the twelve months ended | |||||||
| December 31, 2011 | September 30, 2012 | December 31, 2012 | December 31, 2011 | September 30, 2012 | December 31, 2012 | December 31, 2011 | December 31, 2012 | |||
| Non-GAAP Return on Equity | -20.37% | -9.62% | -24.41% | -81.48% | -38.48% | -97.64% | -24.75% | -47.80% | ||
| Fair value changes of the conversion features of the Convertible bonds | 2.80% | 1.21% | 3.35% | 11.20% | 4.84% | 13.40% | 7.81% | 5.99% | ||
| Accretion of interest of the Convertible bonds | -0.64% | -0.60% | -0.69% | -2.56% | -2.40% | -2.76% | -2.05% | -2.52% | ||
| Unrecognized tax benefit | 0.56% | – | – | 2.24% | – | – | – | 0 | ||
| Severance fee to previous senior management | – | – | – | – | – | 0 | -0.69% | 0 | ||
| Tax impact of severance fee to previous senior management | – | – | – | – | – | 0 | 0.09% | 0 | ||
| GAAP Return on equity | -17.65% | -9.01% | -21.75% | -70.60% | -36.04% | -87.00% | -19.59% | -44.33% | ||


 (Nasdaq: HSOL), a vertically integrated manufacturer of silicon ingots, wafers and photovoltaic (“PV”) cells and modules in China, today reported its unaudited financial…)