

PVTIME – Daqo New Energy Corp. (NYSE: DQ) (“Daqo New Energy,” the “Company” or “we”), a leading manufacturer of high-purity polysilicon for the global solar PV industry, today announced its unaudited financial results for the fourth quarter and fiscal year of 2022.
Fourth Quarter 2022 Financial and Operating Highlights
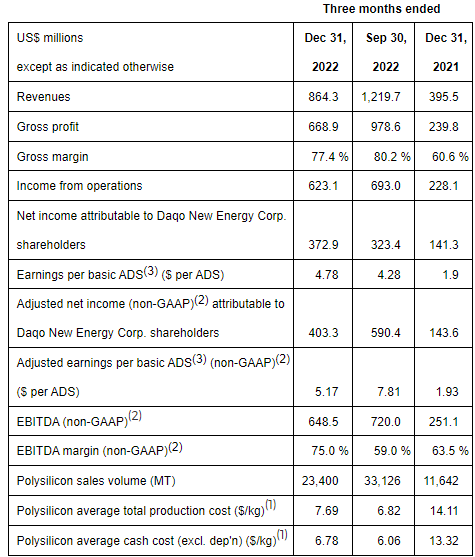
- Polysilicon production volume was 33,702 MT in Q4 2022, compared to 33,401 MT in Q3 2022
- Polysilicon sales volume was 23,400 MT in Q4 2022, compared to 33,126 MT in Q3 2022
- Polysilicon average total production cost(1) was $7.69/kg in Q4 2022, compared to $6.82/kg in Q3 2022
- Polysilicon average cash cost(1) was $6.78/kg in Q4 2022, compared to $6.06/kg in Q3 2022
- Polysilicon average selling price (ASP) was $37.41/kg in Q4 2022, compared to $36.44/kg in Q3 2022
- Revenue was $864.3 million in Q4 2022, compared to $1,219.7 million in Q3 2022
- Gross profit was $668.9 million in Q4 2022, compared to $978.6 million in Q3 2022. Gross margin was 77.4% in Q4 2022, compared to 80.2% in Q3 2022
- Net income attributable to Daqo New Energy Corp. shareholders was $372.9 million in Q4 2022, compared to $323.4 million in Q3 2022
- Earnings per basic American Depositary Share (ADS)(3) was $4.78 in Q4 2022, compared to $4.28 in Q3 2022
- Adjusted net income (non-GAAP)(2) attributable to Daqo New Energy Corp. shareholders was $403.3 million in Q4 2022, compared to $590.4 million in Q3 2022
- Adjusted earnings per basic ADS(3) (non-GAAP)(2) was $5.17 in Q4 2022, compared to $7.81 in Q3 2022
- EBITDA (non-GAAP)(2) was $648.5 million in Q4 2022, compared to $720.0 million in Q3 2022. EBITDA margin (non-GAAP)(2) was 75.0% in Q4 2022, compared to 59.0% in Q3 2022
Full Year 2022 Financial and Operating Highlights
- Polysilicon production volume was 133,812 MT in 2022, compared to 86,587 MT in 2021
- Polysilicon sales volume was 132,909 MT in 2022, compared to 75,356 MT in 2021
- Revenue was $4,608.3 million in 2022, compared to $1,678.8 million in 2021
- Gross profit was $3,407.9 million in 2022, compared to $1,097.2 million in 2021. Gross margin was 74.0% in 2022, compared to 65.4% in 2021
- Net income attributable to Daqo New Energy Corp. shareholders was $1,860.0 million in 2022, compared to $748.9 million in 2021. Earnings per basic ADS was $24.51 in 2022, compared to $10.14 in 2021
- EBITDA (non-GAAP)(2) was $3,150.7 million in 2022, compared to $1,132.8 million in 2021. EBITDA margin (non-GAAP)(2) was 68.4% in 2022, compared to 67.5% in 2021
- Adjusted net income (non-GAAP)(2) attributable to Daqo New Energy Corp. shareholders was $2,162.5 million in 2022, compared to $759.0 million in 2021
- Adjusted earnings per basic ADS(3) (non-GAAP)(2) was $28.50 in 2022, compared to $10.28 in 2021
Notes:
(1) Production cost and cash cost only refer to production in our polysilicon facilities. Production cost is calculated by the inventoriable costs relating to production of polysilicon divided by the production volume in the period indicated. Cash cost is calculated by the inventoriable costs relating to production of polysilicon excluding depreciation expense, divided by the production volume in the period indicated.
(2) Daqo New Energy provides EBITDA, EBITDA margins, adjusted net income attributable to Daqo New Energy Corp. shareholders and adjusted earnings per basic ADS on a non-GAAP basis to provide supplemental information regarding its financial performance. For more information on these non-GAAP financial measures, please see the section captioned “Use of Non-GAAP Financial Measures” and the tables captioned “Reconciliation of non-GAAP financial measures to comparable US GAAP measures” set forth at the end of this press release.
(3) ADS means American Depositary Share. One (1) ADS represents five (5) ordinary shares.
Management Remarks
Mr. Longgen Zhang, CEO of Daqo New Energy, commented, “We are very pleased to report record results for the year 2022. I would like to thank our entire team for achieving such strong financial and operational performance. Our annual polysilicon production volume was 133,812 MT in 2022, exceeding our guidance of 130,000 to 132,000 MT and 54.5% higher than the 86,587 MT produced in 2021. Our sales volume was 132,909 MT in 2022, 76.4% higher than 75,356 MT in 2021. Thanks to the robust demand for solar PV products globally, polysilicon ASPs increased by approximately 50% year over year from $21.76/kg in 2021 to $32.54/kg in 2022. As one of the most profitable and fastest-growing polysilicon manufacturers in the world, we achieved strong financial results with revenue of $4.61 billion in 2022, an increase of 175% compared to $1.68 billion in 2021. Gross margin improved to 74.0% in 2022 from 65.4% in 2021, and net income attributable to our shareholders was $1.86 billion in 2022, an increase of 148.4% compared to $749 million in 2021. We generated approximately $2.47 billion in operating cash flow for the year, and ended the year with a very strong balance sheet with $4.65 billion in combined cash, cash equivalents, restricted cash and bank notes with maturity within 6 months. For the year of 2022, approximately 99% of our production volume was mono-grade polysilicon. We continue to be one of the world’s leading suppliers of ultra-high purity N-type mono polysilicon, the foundation for next-generation N-type solar cell technology. ”
“Towards the end of 2022, a temporary seasonal slowdown in solar PV market caused inventory adjustments across the value chain, similar to the year-end of 2021. As a result, the downstream sectors, especially wafer, cell and module manufacturers, reduced inventories and significantly lowered production utilization rates. This led to widespread price declines across the value chain. In February 2023, lower module prices effectively stimulated market demand, and downstream production utilization rates quickly ramped up back to normal levels, reducing channel inventory significantly and leading to a meaningful recovery in polysilicon ASPs. Current polysilicon prices of approximately RMB 230~250/kg are very healthy and reflect the strong demand for solar modules in the range of RMB 1.7~1.8/watt.”
“Global solar PV installations were approximately 268GW in 2022, a 53% annual increase from approximately 175GW in 2021, growing faster than most had forecasted at the beginning of the year. The increase in polysilicon supply, in conjunction with supportive global climate change policies as well as favorable economic conditions driven by grid-parity, made 2022 one of the industry’s fastest growing years. Meanwhile, solar module price increased from approximately RMB 1.8/watt in Q1 2022 to RMB 2.0/watt in Q4 2022. Despite higher solar module market pricing that many expected would lead to a slowdown in China’s PV installations, the Chinese PV end-market also saw robust growth for the year, with installations of 87GW, an increase of 59% compared to 2021. These market conditions suggest that the global PV market demand was actually limited by supply, specifically of polysilicon. Key global trends, including the urgent need to address climate change, the drive for greater energy independence as well as positive economic conditions driven by grid-parity, have led to strong demand momentum for renewable energies, including solar PV. We believe energy transformation is still in its early stage and has opened a huge potential market for solar PV, which is likely to be far beyond expectations. The high-purity polysilicon sector will continue to benefit strongly from these positive developments.”
“Daqo New Energy is well positioned to benefit from the above trends and deliver continued growth. The construction of our Phase 5A 100,000 MT polysilicon capacity expansion project in Inner Mongolia is progressing smoothly. We expect to complete construction and start pilot production in April 2023 and ramp up to full capacity by the end of June 2023. Therefore, we expect to produce approximately 190,000~195,000 MT of polysilicon in 2023, 42% to 46% more than in 2022. Furthermore, our Phase 5B project for an additional 100,000 MT polysilicon in Inner Mongolia will start construction in March and is expected to be completed by the end of 2023.”
“Solar PV will continue to play a critical role in transforming the global energy infrastructure by powering the world with sustainable, cost-effective and renewable energies at a pace much faster than thought possible. As a leading player in polysilicon industry, we outperformed most of our peers in terms of unit profitability, cost structure, and product quality in 2022. We believe our focus on our core competitiveness, solid growth road-map, and our strong balance sheet will allow us to benefit from the long-term growth of the global solar PV market.”
Outlook and guidance
The Company expects to produce approximately 31,000MT to 32,000MT of polysilicon during the first quarter of 2023. The Company expects to produce approximately 190,000MT to 195,000MT of polysilicon for the full year of 2023, inclusive of the impact of the Company’s annual facility maintenance.
This outlook reflects Daqo New Energy’s current and preliminary view as of the date of this press release and may be subject to changes. The Company’s ability to achieve these projections is subject to risks and uncertainties. See “Safe Harbor Statement” at the end of this press release.
Fourth Quarter 2022 Results
Revenues
Revenues were $864.3 million, compared to $1,219.7 million in the third quarter of 2022 and $395.5 million in the fourth quarter of 2021. The decrease in revenues compared to the third quarter of 2022 was primarily due to a decrease in sales volume mitigated by an increase in ASP.
Gross profit and margin
Gross profit was $668.9 million, compared to $978.6 million in the third quarter of 2022 and $239.8 million in the fourth quarter of 2021. Gross margin was 77.4%, compared to 80.2% in the third quarter of 2022 and 60.6% in the fourth quarter of 2021. The decrease in gross profit compared to the third quarter of 2022 was primarily due to lower sales volume and higher production cost.
Selling, general and administrative expenses
Selling, general and administrative expenses were $44.0 million, compared to $280.2 million in the third quarter of 2022 and $10.2 million in the fourth quarter of 2021. SG&A expenses during the fourth quarter included $28.4 million in non-cash share-based compensation cost related to the Company’s share incentive plans, which was $263.4 million in the third quarter of 2022.
Research and development expenses
Research and development (R&D) expenses were $2.7 million, compared to $2.5 million in the third quarter of 2022 and $1.3 million in the fourth quarter of 2021. Research and development expenses can vary from period to period and reflect R&D activities that take place during the quarter.
Income from operations and operating margin
As a result of the foregoing, income from operations was $623.1 million, compared to $693.0 million in the third quarter of 2022 and $228.1 million in the fourth quarter of 2021.
Operating margin was 72.1%, compared to 56.8% in the third quarter of 2022 and 57.7% in the fourth quarter of 2021.
Net income attributable to Daqo New Energy Corp. shareholders and earnings per ADS
As a result of the aforementioned, net income attributable to Daqo New Energy Corp. shareholders was $372.9 million, compared to $323.4 million in the third quarter of 2022 and $141.3 million in the fourth quarter of 2021.
Earnings per basic American Depository Share (ADS) was $4.78, compared to $4.28 in the third quarter of 2022, and $1.90 in the fourth quarter of 2021.
Adjusted income (non GAAP) attributable to Daqo New Energy Corp. shareholders and adjusted earnings per ADS(non GAAP)
As a result of the aforementioned, adjusted net income (non-GAAP) attributable to Daqo New Energy Corp. shareholders, excluding non-cash share-based compensation costs, was $403.3 million, compared to $590.4 million in the third quarter of 2022 and $143.6 million in the fourth quarter of 2021.
Adjusted earnings per basic American Depository Share (ADS) was $5.17, compared to $7.81 in the third quarter of 2022, and $1.93 in the fourth quarter of 2021.
EBITDA
EBITDA (non-GAAP) was $648.5 million, compared to $720.0 million in the third quarter of 2022 and $251.1 million in the fourth quarter of 2021. EBITDA margin (non-GAAP) was 75.0%, compared to 59.0% in the third quarter of 2022 and 63.5% in the fourth quarter of 2021.
Full Year 2022 Results
Revenues
Revenues were $4,608.3 million, compared to $1,678.8 million in 2021. The increase was primarily due to higher polysilicon ASPs and higher sales volume.
Gross profit and margin
Gross profit was $3,407.9 million, compared to $1,097.2 million in 2021. Gross margin was 74.0%, compared to 65.4% in 2021. The increase in gross profit was primarily due to higher sales volume and ASPs.
Selling, general and administrative expenses
Selling, general and administrative expenses were $354.1 million, compared to $39.9 million in 2021. The increase was primarily due to non-cash share-based compensation cost related to the Company’s 2022 share incentive plan, which was $299.3 million and $8.4 million in 2022 and 2021, respectively.
Research and development expenses
Research and development (R&D) expenses were $10.0 million, compared to $6.5 million in 2021. Research and development expenses can vary from period to period and reflect R&D activities that took place during the period.
Income from operations and operating margin
As a result of the foregoing, income from operations was $3,040.6 million, compared to $1,051.4 million in 2021. Operating margin was 66.0%, compared to 62.6% in 2021.
Interest income/(expense), net
Interest income, net was $14.5 million, compared to $20.5 million net interest expense in 2021. The increase in interest income was due to higher cash at bank balance.
Income tax expense
Income tax expense was $537.1 million, compared to $170.1 million in 2021. The increase was primarily due to higher income before income taxes.
Net income attributable to Daqo New Energy Corp. shareholders and earnings per ADS
Net income attributable to Daqo New Energy Corp. shareholders was $1,860.0 million, compared to $748.9 million in 2021. Earnings per basic ADS were $24.51, compared to $10.14 in 2021.
Adjusted net income (non-GAAP) attributable to Daqo New Energy Corp. shareholders was $2,162.5 million, compared to $759.0 million in 2021. Adjusted earnings per basic ADS (non-GAAP) were $28.50, compared to $10.28 in 2021.
EBITDA
EBITDA (non-GAAP) was $3,150.7 million, compared to $1,132.8 million in 2021. EBITDA margin (non-GAAP) was 68.4%, compared to 67.5% in 2021.
Financial Condition
As of December 31, 2022, the Company had $3,520.4 million in cash, cash equivalents and restricted cash, compared to $3,051.1 million as of September 30, 2022 and $724.0 million as of December 31, 2021. As of December 31, 2022, the notes receivables balance was $1,131.6 million, compared to $1,571.7 million as of September 30, 2022 and $365.9 million as of December 31, 2021. Notes receivables represent bank notes with maturity within six months.
Cash Flows
For the twelve months ended December 31, 2022, net cash provided by operating activities was $2,466.9 million, compared to $639.0 million in the same period of 2021. The increase was primarily due to higher revenues and gross margin.
For the twelve months ended December 31, 2022, net cash used in investing activities was $1,003.5 million, compared to $781.9 million in the same period of 2021. The net cash used in investing activities in 2022 was primarily related to the capital expenditures on the Company’s 100,000 MT polysilicon project in Baotou City, Inner Mongolia.
For the twelve months ended December 31, 2022, net cash provided by financing activities was $1,472.9 million, compared to $736.2 million in the same period of 2021. The net cash provided by financing activities in 2022 was primarily related to the net proceeds of $1,630.6 million from Xinjiang Daqo’s private offering in China.
Use of Non-GAAP Financial Measures
To supplement Daqo New Energy’s consolidated financial results presented in accordance with United States Generally Accepted Accounting Principles (“US GAAP”), the Company uses certain non-GAAP financial measures that are adjusted for certain items from the most directly comparable GAAP measures including earnings before interest, taxes, depreciation and amortization (“EBITDA”) and EBITDA margin; adjusted net income attributable to Daqo New Energy Corp. shareholders and adjusted earnings per basic and diluted ADS. Our management believes that each of these non-GAAP measures is useful to investors, enabling them to better assess changes in key element of the Company’s results of operations across different reporting periods on a consistent basis, independent of certain items as described below. Thus, our management believes that, used in conjunction with US GAAP financial measures, these non-GAAP financial measures provide investors with meaningful supplemental information to assess the Company’s operating results in a manner that is focused on its ongoing, core operating performance. Our management uses these non-GAAP measures internally to assess the business, its financial performance, current and historical results, as well as for strategic decision-making and forecasting future results. Given our management’s use of these non-GAAP measures, the Company believes these measures are important to investors in understanding the Company’s operating results as seen through the eyes of our management. These non-GAAP measures are not prepared in accordance with US GAAP or intended to be considered in isolation or as a substitute for the financial information prepared and presented in accordance with US GAAP; the non-GAAP measures should be reviewed together with the US GAAP measures, and may be different from non-GAAP measures used by other companies.
The Company uses EBITDA, which represents earnings before interest, taxes, depreciation and amortization, and EBITDA margin, which represents the proportion of EBITDA in revenues. Adjusted net income attributable to Daqo New Energy Corp. shareholders and adjusted earnings per basic and diluted ADS exclude costs related to share-based compensation. Share-based compensation is a non-cash expense that varies from period to period. As a result, our management excludes this item from our internal operating forecasts and models. Our management believes that this adjustment for share-based compensation provides investors with a basis to measure the Company’s core performance, including compared with the performance of other companies, without the period-to-period variability created by share-based compensation.
A reconciliation of non-GAAP financial measures to comparable US GAAP measures is presented later in this document.
Conference Call
The Company has scheduled a conference call to discuss the results at 8:00 AM Eastern Time on February 28, 2023. (9:00 PM Beijing / Hong Kong time on the same day).
The dial-in details for the earnings conference call are as follows:
Participant dial in (U.S. toll free): +1-888-346-8982
Participant international dial in: +1-412-902-4272
China mainland toll free: 4001-201203
Hong Kong toll free: 800-905945
Hong Kong local toll: +852-301-84992
Participants please dial in 10 minutes before the call is scheduled to begin and ask to be joined into the Daqo New Energy Corp. call.
You can also listen to the conference call via Webcast through the URL:
https://event.choruscall.com/mediaframe/webcast.html?webcastid=6gptCeKJ
A replay of the call will be available 1 hour after the conclusion of the conference call through March 7, 2023. The dial in details for the conference call replay are as follows:
U.S. toll free: +1-877-344-7529
International toll: +1-412-317-0088
Canada toll free: 855-669-9658
Replay access code: 6823912
To access the replay through an international dial-in number, please select the link below.
https://services.choruscall.com/ccforms/replay.html
Participants will be asked to provide their name and company name upon entering the call.


 (“Daqo New Energy,” the “Company” or “we”), a leading manufacturer of high-purity polysilicon for the global solar PV industry, today announced its…)