

PVTIME – On April 21, Daqo New Energy Corp. (NYSE: DQ) (“Daqo NewEnergy”, the “Company” or “we”), a leading manufacturer ofhigh-purity polysilicon for the global solar PV industry, announced itsunaudited financial results for the first quarter of 2022.
First Quarter 2022 Financial and Operating Highlights
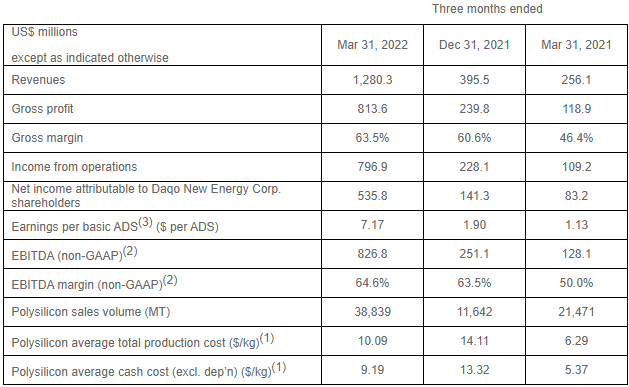
· Polysilicon production volume was 31,383 MTin Q1 2022, compared to 23,616 MT in Q4 2021
· Polysilicon sales volume was 38,839 MT in Q12022, compared to 11,642 MT in Q4 2021
· Polysilicon average total production cost(1)was $10.09/kg in Q1 2022, compared to $14.11/kg in Q4 2021
· Polysilicon average cash cost(1)was $9.19/kg in Q1 2022, compared to $13.32/kg in Q4 2021
· Polysilicon average selling price (ASP) was $32.76/kgin Q1 2022, compared to $33.91/kg in Q4 2021
· Revenue was $1,280.3 million in Q1 2022, compared to $395.5 million in Q4 2021
· Gross profit was $813.6 million in Q1 2022, compared to $239.8 million in Q4 2021. Gross margin was 63.5%in Q1 2022, compared to 60.6% in Q4 2021
· Net income attributable to Daqo New Energy Corp. shareholders was $535.8 million in Q1 2022, compared to $141.3 million inQ4 2021
· Earnings per basic American Depositary Share(ADS)(3) was $7.17 in Q1 2022, compared to $1.90 in Q42021
· EBITDA (non-GAAP)(2) was $826.8 million in Q1 2022, compared to $251.1 million inQ4 2021. EBITDA margin (non-GAAP)(2) was 64.6%in Q1 2022, compared to 63.5% in Q4 2021
Notes:
(1) Productioncost and cash cost only refer to production in our polysilicon facilities.Production cost is calculated by the inventoriable costs relating to productionof polysilicon divided by the production volume in the period indicated. Cashcost is calculated by the inventoriable costs relating to production ofpolysilicon excluding depreciation expense, divided by the production volume inthe period indicated.
(2) Daqo NewEnergy provides EBITDA and EBITDA margins on a non-GAAP basis to providesupplemental information regarding its financial performance. For moreinformation on these non-GAAP financial measures, please see the sectioncaptioned “Use of Non-GAAP Financial Measures” and the tablescaptioned “Reconciliation of non-GAAP financial measures to comparable USGAAP measures” set forth at the end of this press release.
(3) ADSmeans American Depositary Share. One (1) ADS representing five (5) ordinaryshares.
Management Remarks
Mr. LonggenZhang, CEO of Daqo New Energy, commented, “We are very pleased to report exceptionalresults for the first quarter of 2022, the best-ever in the company’s history.I would like to thank our entire team for their hard work and dedication indelivering such excellent operational and financial performance. For thequarter, we achieved polysilicon sales volume of 38,839 MT, more than 3 timesour sales volume for the fourth quarter of 2021. We recorded $1.3 billion inrevenue, also more than 3 times of the revenue for the fourth quarter of 2021, andwe recorded operating income of $797 million, net income attributable to DaqoNew Energy shareholders of $536 million, earning per share (“EPS”) of $7.17 pershare and EBITDA of $827 million, all representing substantial sequential andyear-over-year growth. At the end of the quarter, our combined cash, short terminvestments, and bank note receivable balance reached $2.6 billion, an increaseof $1.2 billion compared to the end of 2021. This strong financial performance reflectsnot only the strength of the end market but also the trust that our customersplace in the quality and reliability of our high-purity mono-grade polysiliconproducts.”
“Last December, we began production atour new 35,000MT phase 4B polysilicon expansion project. Production ramp up wassuccessful throughout the first quarter. During the first quarter we produced31,383 MT of polysilicon, a 33% increase compared to the fourth quarter of2021, of which 97.2% was mono-grade. In the first quarter,our production cost was $10.09/kg,a significant decrease from $14.11/kg in the fourth quarter of 2021, primarilydue to the decrease in the cost of silicon powder, as well as manufacturingefficiency improvements and better economies of scale.”
“We continue to see very strong demand for solar PV productsboth in China and overseas. In the first two months of 2022, new installationsof solar PV in China were approximately 10.9 GW. According to the ChinaPhotovoltaic Industry Association, new PV installations in China are expectedto increase from 53 GW in 2021 to 75-90 GW in 2022. In the first two months of2022, based on China’s custom’s data, China’s solar PV module export volume wasapproximately 26 GW, doubled from the same period in 2021. As a result of thestronger-than-expected market demand, product pricing across the entire solarPV value chain increased consistently during the first quarter. Based onstatistics from the China Silicon Industry Association, the average market ASPs(VAT included) of small chunk mono-grade polysilicon increased from RMB 231.8/kgin the first week of January to RMB 253.3/kg in the third week of April,reflecting healthy demand from our customers and continued tight supplies. Wealso see healthy gross margin in the downstream wafer sector which indicatesthat the solar value chain is able to pass down the impact of strongpolysilicon prices to the end market.”
“Global trendscontinue to favor the solar industry, which particularly benefits the polysiliconsector. We are beginning to witness significant policy shifts to accelerateclean energy adoption and de-carbonization around the world. During the monthof March 2022, the European Union announced its RePowerEU initiative, whichcalls for an acceleration of clean energy transition under the European GreenDeal. Germany, in particular, has announced an ambitious program tosignificantly accelerate its clean energy transition, with plans to deploy 22GWof solar installations per year starting 2026, a four-fold increase from 2021installations of 5.3GW. As solar energy has already achieved grid-paritybroadly in many regions globally, the recent spike in high and volatile energyprices will further drive solar energy adoption with attractive economicreturns. All these factors will lead to additional demand for solar productswhich cannot be met by the current market supply. We believe the polysiliconsector will remain one of the most profitable sectors in the solar PV valuechain, as polysilicon will continue to be in short supply and determine theactual pace and total volume of global installations. We will continue tofocus on the efficient operation of our core business, increase our capacitybased on market needs, continue to enhance our competitiveness in quality andreliability, and further optimize our cost structure to provide consistent returnsto our shareholders.”
Outlookand guidance
The Company expects to produceapproximately 32,000MT to 34,000MT of polysilicon in the second quarter of 2022and approximately 120,000MT to 125,000MT of polysilicon in the full year of 2022,inclusive of the impact of the Company’s annual facility maintenance.
Thisoutlook reflects Daqo New Energy’s current and preliminary view as of the dateof this press release and may be subject to changes. The Company’s ability toachieve these projections is subject to risks and uncertainties. See “SafeHarbor Statement” at the end of this press release.
Revenues were $1,280.3 million,compared to $395.5 million in the fourth quarter of 2021 and $256.1 million inthe first quarter of 2021. The increase in revenues as compared to the fourthquarter of 2021 was primarily due to significantly higher polysilicon salesvolume partially offset by slightly lower ASPs.
Grossprofit and margin
Gross profit was $813.6 million,compared to $239.8 million in the fourth quarter of 2021 and $118.9 million inthe first quarter of 2021. Gross margin was 63.5%, compared to 60.6% in the fourthquarter of 2021 and 46.4% in the first quarter of 2021. The increase in gross profitas compared to the fourth quarter of 2021 was primarily due to higher salesvolume. The increase in gross margin as compared to the fourth quarter of 2021was primarily due to lower production cost partially offset by lower ASPs.
Selling,general and administrative expenses
Selling,general and administrative expenses were $15.5 million, compared to $10.2million in the fourth quarter of 2021 and $9.0 million in the first quarter of 2021.The increase in SG&A expenses as compared to the fourth quarter of 2021 wasprimarily due to an increase in shipment expenses as a result of increasedsales volume. SG&A expenses during the first quarter included $2.0 million innon-cash share-based compensation costs related to the Company’s shareincentive plan.
Researchand development expenses
Research and development (R&D) expenseswere $2.1 million, compared to $1.3 million in the fourth quarter of 2021 and$1.2 million in the first quarter of 2021. Research and development expenses canvary from period to period and reflect R&D activities that take placeduring the quarter.
Incomefrom operations and operating margin
As a result of the foregoing, incomefrom operations was $796.9 million, compared to $228.1 million in the fourthquarter of 2021 and $109.2 million in the first quarter of 2021.
Operating margin was 62.2%, compared to57.7% in the fourth quarter of 2021 and 42.6% in the first quarter of 2021.
EBITDA(non-GAAP)
EBITDA (non-GAAP) was $826.8 million,compared to $251.1 million in the fourth quarter of 2021 and $128.1 million inthe first quarter of 2021. EBITDA margin (non-GAAP) was 64.6%, compared to 63.5%in the fourth quarter of 2021 and 50.0% in the first quarter of 2021.
Netincome attributable to Daqo New Energy Corp. shareholders and earnings per ADS
As a result of the aforementioned, netincome attributable to Daqo New Energy Corp. shareholders was $535.8 million,compared to $141.3 million in the fourth quarter of 2021 and $83.2 million in thefirst quarter of 2021.
Earnings per basic American DepositoryShare (ADS) was $7.17, compared to $1.90 in the fourth quarter of 2021, and $1.13in the first quarter of 2021.
FinancialCondition
Asof March 31, 2022, the Company had $1,127.7 million in cash, cash equivalentsand restricted cash, compared to $724.0 million as of December 31, 2021 and $227.8million as of March 31, 2021. As of March 31, 2022, the notes receivablebalance was $1,499.4 million, compared to $365.9 million as of December 31,2021 and $38.5 million as of March 31, 2021. The increase in notes receivablescompared to December 31, 2021 was primarily due to higher revenues and advancepayments from customers. As of March 31, 2022, total borrowings were nil,compared to nil as of December 31, 2021 and total borrowings of $222.2 million,including $100.4 million long-term borrowings, as of March 31, 2021.
Cash Flows
For the three months ended March 31, 2022,net cash provided by operating activities was $231.3 million, compared to $159.2million in the same period of 2021. The increase was primarily due to higherrevenues and gross margin.
Forthe three months ended March 31, 2022, net cash provided by investingactivities was $170.4 million, compared to net cash used in investingactivities of $79.9 million in the same period of 2021. The net cash used ininvesting activities in Q1 2021 was primarily related to the capitalexpenditures on the Company’s Phase 4B and 4A polysilicon projects. The netcash provided by investing activities in Q1 2022 was primarily due to the redemptionof short-term investments offset by the capital expenditures on the Company’sPhase 4B project and Inner Mongolia polysilicon project.
Forthe three months ended March 31, 2022, net cash provided by financingactivities was nil, compared to net cash used in financing activities of $31.7million in the same period of 2021.
Use of Non-GAAP Financial Measures
To supplement Daqo New Energy’sconsolidated financial results presented in accordance with United StatesGenerally Accepted Accounting Principles (“US GAAP”), the Company uses certainnon-GAAP financial measures that are adjusted for certain items from the mostdirectly comparable GAAP measures including earnings before interest, taxes,depreciation and amortization (“EBITDA”) and EBITDA margin (which representsthe proportion of EBITDA in revenues). Our management believes that each ofthese non-GAAP measures is useful to investors, enabling them to better assesschanges in key element of the Company’s results of operations across differentreporting periods on a consistent basis, independent of certain items asdescribed below. Thus, our management believes that, used in conjunction withUS GAAP financial measures, these non-GAAP financial measures provide investorswith meaningful supplemental information to assess the Company’s operatingresults in a manner that is focused on its ongoing, core operating performance. Ourmanagement uses these non-GAAP measures internally to assessthe business, its financial performance, current and historical results, aswell as for strategic decision-making and forecasting future results. Given ourmanagement’s use of these non-GAAP measures, the Company believes these measuresare important to investors in understanding the Company’s operating results asseen through the eyes of our management. These non-GAAP measures are notprepared in accordance with US GAAP or intended to be considered in isolationor as a substitute for the financial information prepared and presented inaccordance with US GAAP; the non-GAAP measures should be reviewed together withthe US GAAP measures, and may be different from non-GAAP measures used by othercompanies.
Areconciliation of non-GAAP financial measures to comparable US GAAP measures ispresented later in this document.
Conference Call
The Company has scheduled a conference call to discussthe results at 8:00 AM Eastern Time on April 21, 2022. (8:00 PM Beijing / Hong Kong time on the sameday).
The dial-in details for the live conference call are asfollows:
| Participant dial in (toll free): | +1-888-346-8982 |
| Participant international dial in: | +1-412-902-4272 |
| China mainland toll free: | 4001-201203 |
| Hong Kong toll free: | 800-905945 |
| Hong Kong-local toll: | +852-301-84992 |
| Participants please dial in 10 minutes before the call is scheduled to begin and ask to be joined into the Daqo New Energy Corp. call. |
You can also listen to the conferencecall via Webcast through the URL:
https://services.choruscall.com/mediaframe/webcast.html?webcastid=81uk8uIG
A replay of the call will be available 1 hour after theend of the conference through April 28, 2022.
Theconference call replay numbers are as follows:
| US Toll Free: | +1-877-344-7529 |
| International Toll: | +1-412-317-0088 |
| Canada Toll Free: | 855-669-9568 |
| Replay access code: | 6420441 |
To access thereplay using an international dial-in number, please select the link below.
https://services.choruscall.com/ccforms/replay.html
Participants will be required to state their name and company upon entering the call.


 (“Daqo NewEnergy”, the “Company” or “we”), a leading manufacturer ofhigh-purity polysilicon for the global solar PV industry, announced itsunaudited…)