

PVTIME – In August, the production of raw coal in industries above designated size changed from decline to rise, the production of crude oil increased steadily, the growth of natural gas accelerated, and the growth of electric power decreased greatly. Based on August 2019, the two-year average growth rate of raw coal production has changed from negative to positive, crude oil production has remained stable, and natural gas and power production have increased rapidly.
I. Raw Coal, Crude Oil and Natural Gas Production and Relevant Information
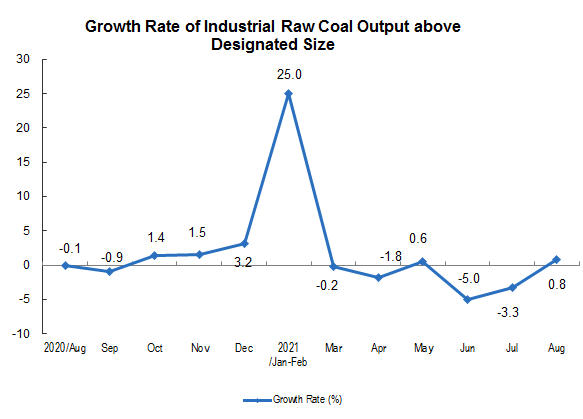
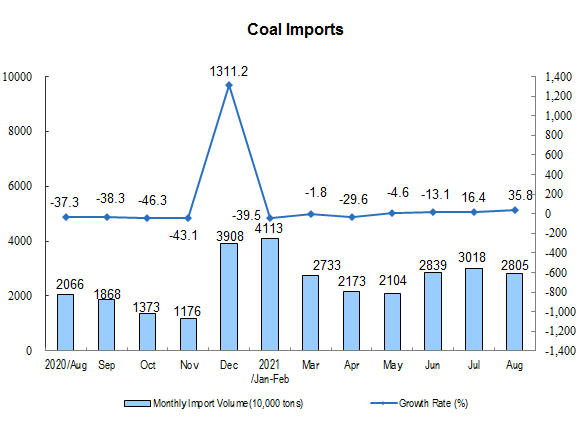
Raw coal production has changed from down to up. In August, 340 million tons of raw coal were produced, with a year-on-year growth rate of 0.8 percent instead of a decrease of 3.3 percent last month, an increase of 0.7 percent over the same period in 2019, an average increase of 0.3 percent in two years, and an average daily output of 10.81 million tons. 28.05 million tons of coal were imported, a year-on-year increase of 35.8 percent.
From January to August, 2.6 billion tons of raw coal were produced, with a year-on-year increase of 4.4 percent, an increase of 4.2 percent over the same period in 2019, and an average increase of 2.1 percent in two years; 197.69 million tons of coal were imported, a year-on-year decrease of 10.3 percent.
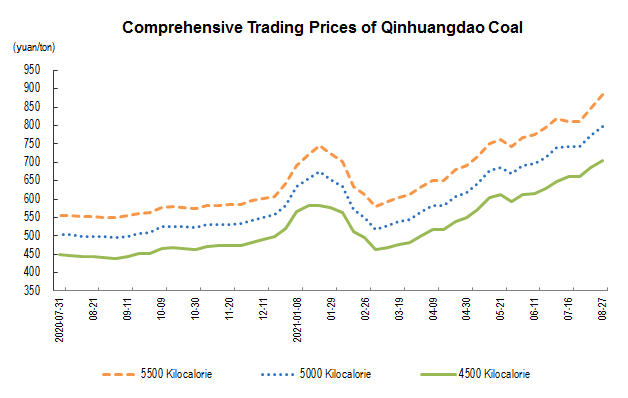
The comprehensive trading price of port coal rose. On August 27, the comprehensive transaction prices of 5500, 5000 and 4500 kcal thermal coal in Qinhuangdao Port were 885, 798 and 706 yuan per ton respectively, up 40, 25 and 20 yuan respectively compared with July 30.
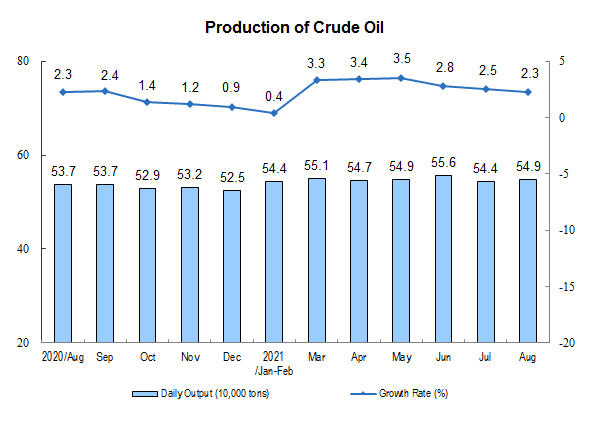
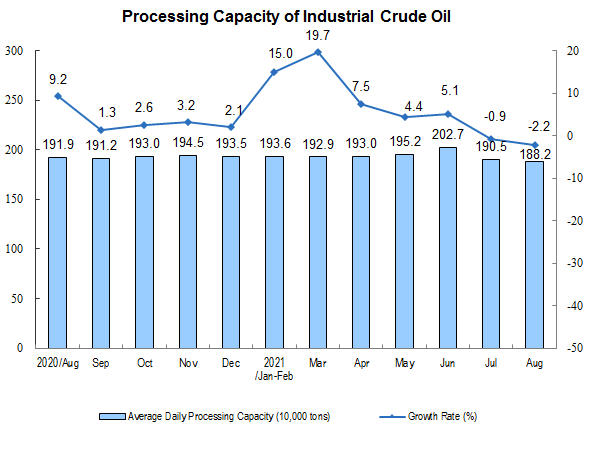
Crude oil production was stable and the decline in processing capacity was expanded. In August, it produced 17.03 million tons of crude oil, a year-on-year increase of 2.3 percent, a decrease of 0.2 percentage point over the previous month, an increase of 4.7 percent over the same period in 2019, an average increase of 2.3 percent over the two years, and an average daily output of 549,000 tons; 58.35 million tons of crude oil were processed, a year-on-year decrease of 2.2 percent, an increase of 1.3 percentage points over the previous month, an increase of 6.8 percent over the same period in 2019, an average increase of 3.3 percent over the two years, and an average daily processing of 1.882 million tons.
From January to August, 133.22 million tons of crude oil were produced, a year-on-year increase of 2.4 percent, an increase of 4.0 percent over the same period in 2019, and an average increase of 2.0 percent over the two years; 470.79 million tons of crude oil were processed, with a year-on-year increase of 7.4 percent, an increase of 10.8 percent over the same period in 2019, and an average increase of 5.3 percent over the two years.
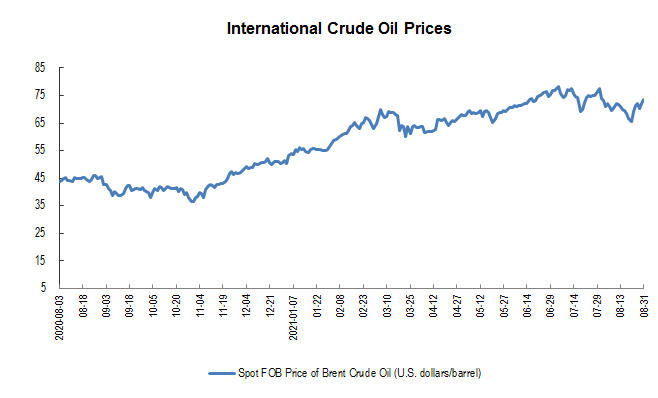
The decline in crude oil imports continued to narrow, and the international crude oil price fell slightly. In August, the imported crude oil was 44.53 million tons, a year-on-year decrease of 6.2 percent, 13.0 percentage points lower than that of the previous month; from January to August, the imported crude oil was 346.36 million tons, a year-on-year decrease of 5.7 percent. In August, the international oil price still fluctuated in the range of 65 – 75 USD per barrel. On August 31, the spot FOB price of Brent crude oil was 73.45 USD per barrel, down 5.5 percent from 77.72 USD per barrel on July 30.

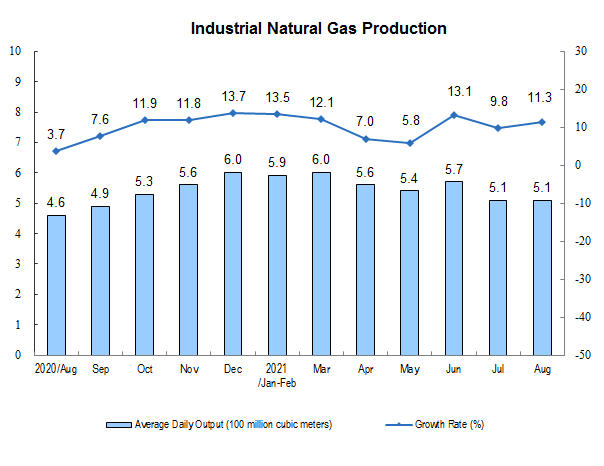
Natural gas production has accelerated. In August, the production of natural gas was 15.9 billion cubic meters, a year-on-year increase of 11.3 percent, 1.5 percentage points faster than the previous month, 15.5 percent higher than the same period in 2019, an average increase of 7.5 percent in two years, and an average daily output of 510 million cubic meters.
From January to August, 136.1 billion cubic meters of natural gas were produced, with a year-on-year increase of 10.8 percent, an increase of 20.5 percent over the same period in 2019, and an average increase of 9.8 percent over the two years.
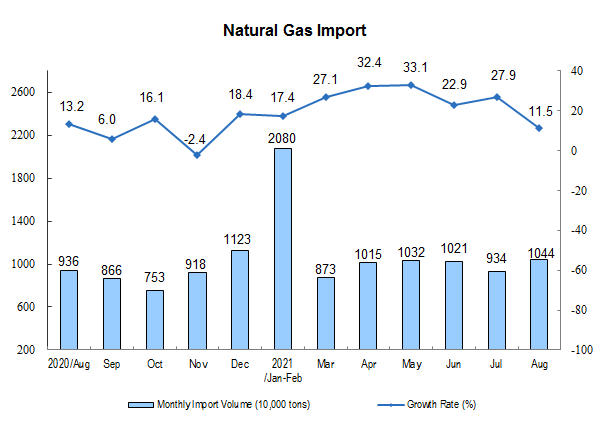
The growth rate of natural gas imports fell. In August, 10.44 million tons of natural gas were imported, with a year-on-year increase of 11.5 percent, down 16.4 percentage points from the previous month. From January to August, 79.31 million tons of natural gas were imported, with a year-on-year increase of 22.2 percent.
II. Electric Power Production
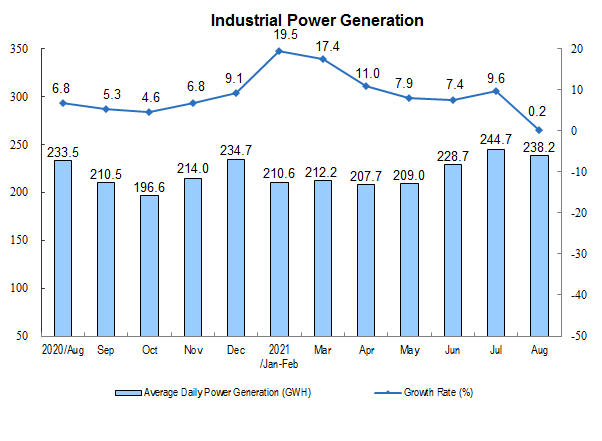
The growth rate of electric power has dropped greatly. In August, the power generation was 738.3 billion kwh, a year-on-year increase of 0.2 percent, a decrease of 9.4 percentage points over the previous month, an increase of 7.1 percent over the same period in 2019, an average increase of 3.5 percent over the two years, and an average daily power generation of 23.82 billion kwh. From January to August, the power generation was 5,389.4 billion kwh, a year-on-year increase of 11.3 percent, an increase of 11.6 percent over the same period in 2019, and an average increase of 5.7 percent over the two years.
In terms of varieties, in August, the growth of thermal power, nuclear power, wind power and solar power slowed down, and the decline of hydropower expanded slightly. Among them, thermal power increased by 0.3 percent year-on-year, with August 2019 as the base period, with an average growth of 3.2 percent in two years; hydropower decreased by 4.7 percent, with an average increase of 1.9 percent in the two years; nuclear power increased by 10.2 percent, with an average growth of 5.5 percent in the two years; wind power increased by 7.0 percent, with an average increase of 12.7 percent in two years; solar power generation increased by 8.5 percent, with an average growth of 5.3 percent in the two years.
Annotations:
1. Explanatory Notes
Average daily product output: It is calculated by dividing the total output of Industrial Enterprises above the designated size announced in that month by the calendar days of that month.
2. Statistical Coverage
The statistical caliber of the output data in the report is above the designated size of industry, and the statistical scope is industrial enterprises with annual main business income of more than 20 million yuan.
Because the scope of Industrial Enterprises above the designated size changes every year, in order to ensure that this year’s data is comparable with the previous year’s, the same period used to calculate the growth rate of various indicators such as product output is consistent with the statistical scope of enterprises in this period, and there is a caliber difference between the data released last year.
3. Data Source
Import data comes from the General Administration of Customs, of which March data are express data; coal price data comes from China Coal Market Network; crude oil price data comes from the United States Energy Information Agency (EIA).
4. Conversion relationship of natural gas units: 1 ton is equal to 1380 cubic meters.
5. The two-year average growth rate refers to the growth rate calculated by geometric average method based on the corresponding number of the same period in 2019.FAQs | About NBS | Contact Us | Copyright National Bureau of Statistics of China,2012


